
The Bullish Stalled candlestick formation is a three‑candle reversal pattern that often appears at the bottom of a downtrend. It reflects a gradual weakening of seller strength, where bearish momentum fades and hesitation begins to dominate. Though understated in appearance, this pattern can serve as an early indication that buyers may soon regain control.
Candle Sequence in Detail
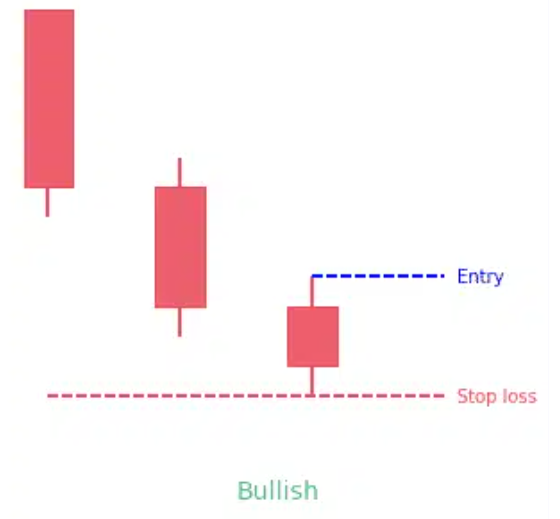
- First Candle – Strong Bearish Drive: A long bearish candle continues the prevailing downtrend, showing clear seller dominance.
- Second Candle – Reduced Force: Another bearish candle forms, but it is smaller in size, suggesting that downward momentum is slowing.
- Third Candle – Hesitation and Pause: A small bearish candle, often resembling a spinning top or doji, closes near the second candle’s level, signaling indecision and exhaustion among sellers.
Distinctive Attributes
- Typically emerges after a prolonged decline, making it a potential reversal marker.
- Each candle demonstrates progressively weaker bearish momentum, highlighting fading conviction.
- The third candle reflects stalling behavior, where sellers hesitate and buyers begin to sense opportunity.
- The signal gains credibility when followed by a bullish confirmation candle.
Sentiment Dynamics
- Seller Control: The first candle reflects strong pessimism, with sellers pushing prices lower.
- Momentum Weakens: The second candle shows reduced strength, as fewer sellers step in.
- Indecision Emerges: The final candle highlights hesitation, suggesting exhaustion among sellers.
- Buyer Interpretation: Traders view this as a warning that bearish momentum is fading, prompting them to prepare for a reversal.
This psychological sequence illustrates how the Bullish Stalled pattern captures the gradual transition from dominance to vulnerability.
Analytical Considerations
- The Bullish Stalled is subtle, making it less obvious than other reversal patterns.
- Without confirmation, it may represent only consolidation rather than a true reversal.
- Best interpreted when paired with momentum indicators (RSI, MACD), moving averages, or volume analysis to validate the setup.
Contextual Importance
- At Market Bottoms: Acts as a warning that bearish enthusiasm may be fading.
- During Extended Declines: Serves as a sign that sellers are losing conviction.
- Volume Confirmation: Heavy trading activity during subsequent bullish candles adds credibility to the reversal signal.
Final Insight
The Bullish Stalled candlestick pattern is a subtle but important warning sign of weakening bearish momentum. Its gradual nature makes it easy to overlook, yet when recognized in the right context, it provides traders with valuable foresight into potential reversals. By identifying this formation at the bottom of a downtrend, market participants can prepare for recoveries and manage risk more effectively, making it a useful addition to candlestick analysis.