
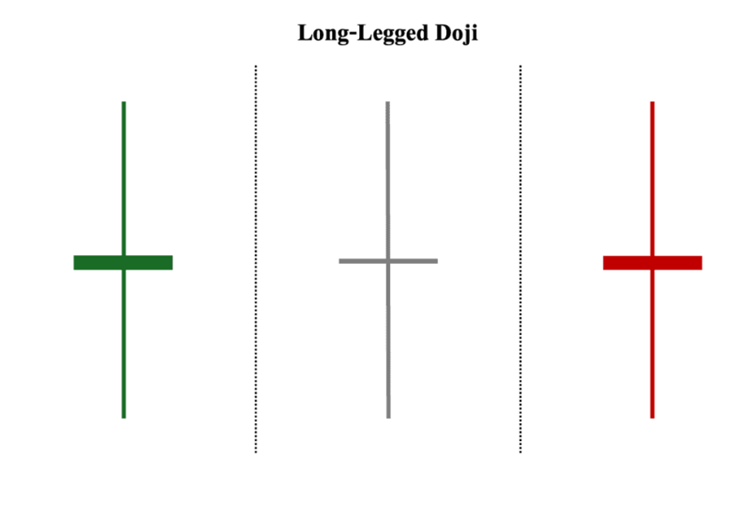
The Long‑Legged Doji candlestick formation is a single‑candle pattern that reflects extreme market hesitation. Its defining feature is the combination of a very small body with unusually long upper and lower shadows, showing that prices fluctuated widely during the session but ultimately closed near the opening level.
Candle Anatomy
- Body: Extremely small or nonexistent, with the open and close nearly identical.
- Upper Shadow: Very long, indicating buyers pushed prices significantly higher during the session.
- Lower Shadow: Equally long, showing sellers forced prices downward before recovery.
- Appearance: Resembles a cross or plus sign with extended vertical lines, making it visually distinctive.
Distinctive Attributes
- Can appear in both uptrends and downtrends, making it versatile but context‑dependent.
- Represents indecision and hesitation, as neither buyers nor sellers establish control.
- Gains significance when it forms near support or resistance zones, where sentiment shifts are more meaningful.
- Often precedes consolidation or reversal, depending on subsequent confirmation.
Sentiment Dynamics
- Buyer Push: Prices rise sharply as buyers attempt to extend control.
- Seller Response: Sellers counter aggressively, dragging prices lower.
- Final Outcome: The open and close being nearly equal shows no decisive victory, leaving the market in a state of uncertainty.
This psychological tug‑of‑war highlights how the Long‑Legged Doji captures hesitation, reflecting a balance between optimism and caution.
Analytical Considerations
- The Long‑Legged Doji is neutral on its own, offering no directional certainty.
- False signals are common, making confirmation essential.
- Best interpreted when paired with momentum indicators (RSI, MACD), moving averages, or volume analysis to validate the breakout or reversal.
Contextual Importance
- At Market Tops or Bottoms: Can serve as a warning of potential turning points.
- During Strong Trends: May indicate a pause or exhaustion before continuation.
- Volume Confirmation: Higher trading activity during a Long‑Legged Doji session adds weight to its significance.
Final Insight
The Long‑Legged Doji candlestick pattern is a clear sign of market indecision. While it does not provide directional certainty on its own, recognizing it helps traders anticipate potential breakouts or reversals when combined with other signals. Its distinctive structure — a small body with very long shadows — makes it a valuable tool for technical analysts seeking to understand market psychology and prepare for shifts in momentum.