
The Aberration Indicator is a hybrid technical analysis tool that merges moving averages with volatility measures, specifically the Average True Range (ATR). Its primary role is to highlight potential breakouts, reversals, and shifts in market volatility. By dynamically adjusting to price behavior, it provides traders with a flexible framework for interpreting market conditions.
Structural Components
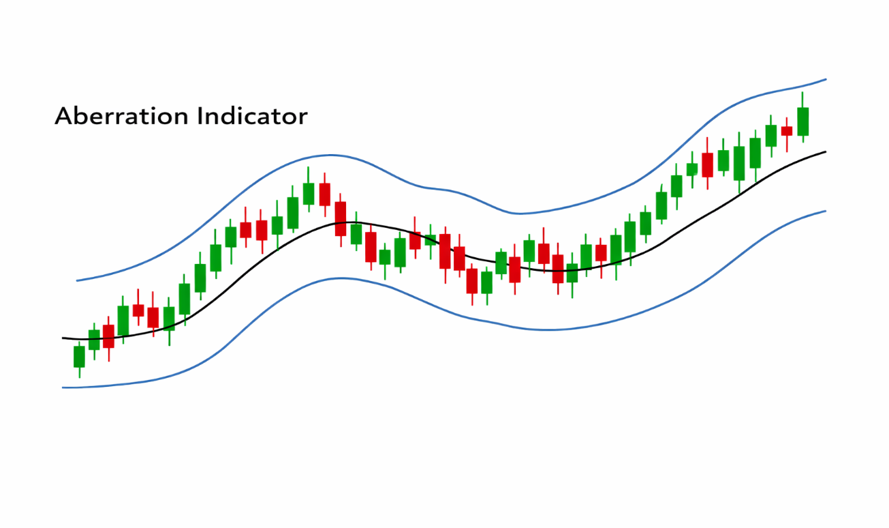
The Aberration Indicator is built around three adaptive bands:
- Upper Band: A simple moving average of highs plus ATR multiplied by a factor.
- Middle Band: A simple moving average of closing prices, acting as the central trend line.
- Lower Band: A simple moving average of lows minus ATR multiplied by a factor.
Interpretation:
- Price above the upper band → Possible breakout or overbought scenario.
- Price below the lower band → Potential reversal or oversold condition.
- Price near the middle band → Trend confirmation or sideways consolidation.
Distinctive Attributes
- Adaptive Support & Resistance: Bands shift with volatility, creating flexible trading zones.
- Trend Recognition: Position relative to the middle band signals bullish or bearish bias.
- Volatility Awareness: Band width expands during turbulent markets and contracts in calmer phases.
- Breakout Alerts: Narrow bands often precede sharp directional moves.
- Multi‑Timeframe Relevance: Effective across intraday, swing, and positional setups.
Market Psychology Reflected
- Above Upper Band: Buyers dominate, often signaling aggressive momentum.
- Below Lower Band: Sellers take control, reflecting pessimism or exhaustion of buyers.
- Around Middle Band: Market indecision, where consolidation or trend validation occurs.
This dynamic behavior mirrors the tug‑of‑war between buyers and sellers, with volatility acting as the amplifier.
Analytical Considerations
- The Aberration Indicator is volatility‑sensitive, making it especially useful in markets prone to sudden expansions or contractions.
- Traders often combine it with RSI, MACD, or volume studies to filter false signals.
- It is particularly effective in trend‑driven environments, but less reliable in erratic sideways conditions without confirmation.
Contextual Importance
- Entry & Exit Guidance: Traders often buy near the lower band in bullish phases and sell near the upper band in bearish phases.
- Risk Management: Bands provide volatility‑adjusted stop‑loss levels.
- Position Sizing: Wider bands indicate higher risk, guiding traders to adjust exposure.
- Reversal Clues: Divergence between price action and band movement can hint at turning points.
Final Insight
The Aberration Indicator is a versatile blend of volatility and trend analysis. Its adaptive nature equips traders with dynamic support/resistance levels, breakout signals, and risk management cues. While it excels in trending markets, pairing it with other momentum or volume indicators ensures stronger reliability. For traders seeking a volatility‑aware framework, the Aberration Indicator offers a structured lens to interpret price action with confidence and discipline.