
The Advance/Decline Line (A/D Line) is a widely used breadth indicator that measures overall market participation by comparing the number of advancing stocks to declining stocks. It provides a deeper perspective on whether rallies or sell‑offs are supported by broad market involvement or driven by a handful of large‑cap names.
Structural Components
- Advancing Issues: Count of stocks closing higher than their previous session.
- Declining Issues: Count of stocks closing lower than their previous session.
- Formula:
[ A/D Line = t{Previous A/D Value} + {Advancing Issues} – {Declining Issues} ]
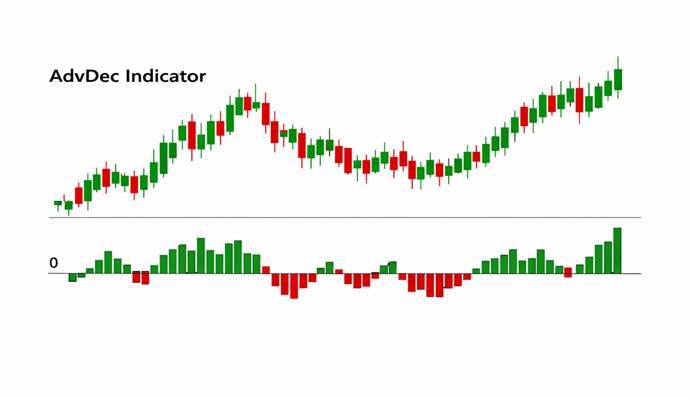
The result is plotted as a cumulative line alongside major indices such as the S&P 500 or Nifty 50, offering a visual comparison between index performance and underlying breadth.
Distinctive Attributes
- Breadth Measurement: Reveals whether a rally is broad‑based or concentrated.
- Trend Validation: A rising A/D Line confirms bullish sentiment, while a falling line signals bearish undertones.
- Divergence Detection: When an index climbs but the A/D Line declines, it warns of weakening participation.
- Versatility: Applicable across equities, indices, and exchange‑traded funds.
Market Psychology Reflected
- Rising A/D Line: Indicates widespread buying, showing confidence across sectors.
- Falling A/D Line: Suggests broad selling pressure, reflecting pessimism.
- Divergence: When price and breadth move in opposite directions, it highlights hidden weakness or strength not visible in index levels alone.
This dynamic captures the collective behavior of market participants, offering insight into whether trends are sustainable.
Analytical Considerations
- The A/D Line is especially useful in avoiding misleading signals from indices dominated by a few heavyweight stocks.
- Traders often combine it with volume studies, moving averages, or momentum indicators to strengthen reliability.
- It is particularly effective in trend confirmation and reversal anticipation, where divergences provide early warnings.
Contextual Importance
- During Bull Markets: A rising A/D Line validates that rallies are supported by broad participation.
- During Bear Markets: A declining A/D Line confirms widespread weakness.
- In Sideways Phases: Divergences between price and breadth often precede breakouts or breakdowns.
Final Insight
The Advance/Decline Line is a powerful tool for understanding market breadth and sentiment. By highlighting whether rallies or declines are supported by broad participation, it helps traders confirm the sustainability of trends. When paired with price action and volume indicators, it provides a more complete picture of market health, reducing the risk of being misled by index movements alone.