
The Williams %R Indicator, created by Larry Williams, is a momentum‑based oscillator that evaluates whether prices are trading near recent highs or lows. It is often compared to the Stochastic Oscillator but inverted, producing values between 0 and ‑100. This bounded scale makes it straightforward to interpret, especially for short‑term traders who rely on precise signals to time entries and exits.
Structural Components
The calculation of Williams %R involves three inputs:
- Highest High (HH): The peak price over a chosen lookback period (commonly 14 days).
- Lowest Low (LL): The lowest price during the same timeframe.
- Close (C): The most recent closing price.
Formula:
[ %R = {(HH – C)}{(HH – LL)} -100 ]
- Values range between 0 and ‑100.
- Readings near 0 → Market is close to its high (potentially overbought).
- Readings near ‑100 → Market is close to its low (potentially oversold).
Distinctive Attributes
- Bounded Oscillator: Always confined between 0 and ‑100, simplifying interpretation.
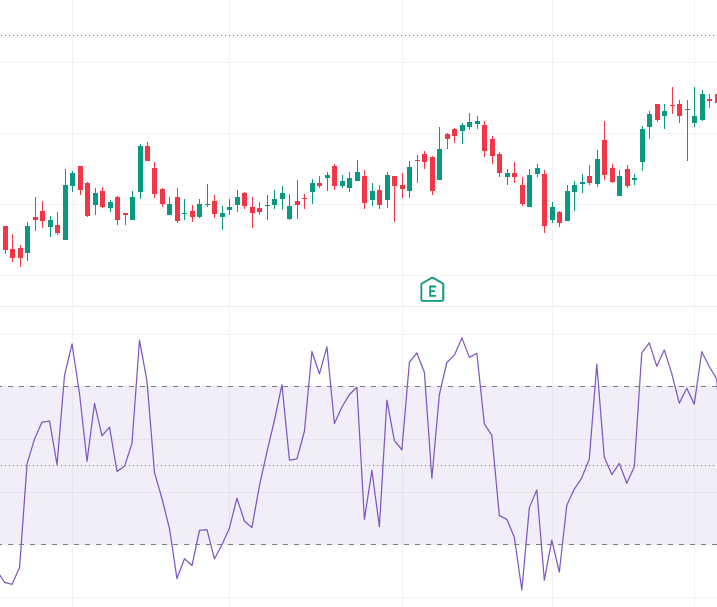
- Overbought/Oversold Zones: Above ‑20 suggests overbought; below ‑80 suggests oversold.
- Quick Responsiveness: Reacts rapidly to price changes, making it ideal for short‑term analysis.
- Divergence Alerts: Highlights potential reversals when price and %R move in opposite directions.
- Cross‑Market Utility: Effective across equities, forex, commodities, and indices.
Market Psychology Reflected
- Near 0: Buyers dominate, pushing price toward recent highs.
- Near ‑100: Sellers are in control, dragging price toward recent lows.
- Mid‑Range Values: Reflect balance or consolidation, where neither side has clear dominance.
This dynamic illustrates how Williams %R captures the tug‑of‑war between bullish enthusiasm and bearish pressure.
Analytical Considerations
- Williams %R is highly sensitive, making it effective in trending markets but prone to false signals in sideways conditions.
- Traders often combine it with moving averages, MACD, Bollinger Bands, or volume studies to confirm reliability.
- It is particularly useful for short‑term setups, where capturing momentum shifts early can improve timing.
Contextual Importance
- Trend Confirmation: Sustained readings near the extremes validate bullish or bearish strength.
- Entry & Exit Guidance: Helps traders time trades when price approaches overbought or oversold zones.
- Risk Awareness: Prevents chasing trades by highlighting exhaustion levels.
- Reversal Clues: Divergence between price action and %R can serve as an early warning of weakening momentum.
Final Insight
The Williams %R Indicator is a straightforward yet powerful momentum tool. Its bounded nature makes interpretation simple, while its responsiveness ensures timely signals for short‑term strategies. By highlighting overbought and oversold conditions, it equips traders with actionable insights for timing entries, exits, and managing risk. When paired with trend‑following or volume‑based indicators, Williams %R becomes a reliable framework for navigating bullish and bearish markets with confidence.