
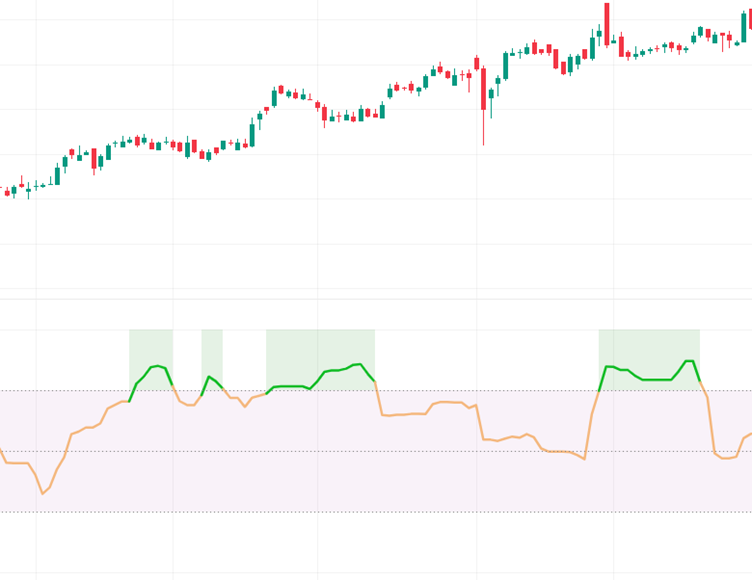
The TTM Indicator, also known as the TTM Squeeze or Trend Trigger Momentum, was developed by John Carter to help traders identify consolidation phases that often precede explosive market moves. By combining volatility and momentum concepts, it highlights when price is “squeezing” between Bollinger Bands and Keltner Channels, signaling that a breakout may be imminent once volatility expands.
Structural Components
The TTM Indicator is constructed using:
- Bollinger Bands (BB): Measure volatility using standard deviations around a moving average.
- Keltner Channels (KC): Use the Average True Range (ATR) to define volatility boundaries.
- Squeeze Condition: Occurs when Bollinger Bands contract inside Keltner Channels, indicating low volatility.
- Momentum Histogram: Plotted to show the direction and strength of momentum during and after the squeeze.
This framework allows traders to visualize both volatility compression and momentum expansion in one chart.
Distinctive Attributes
- Volatility Compression Detection: Highlights quiet phases where markets are coiling for a move.
- Momentum Visualization: Histogram bars show bullish or bearish strength.
- Breakout Alerts: Squeeze releases often precede sharp directional moves.
- Noise Filtering: Focuses on volatility cycles rather than minor fluctuations.
- Cross‑Market Utility: Effective across equities, forex, commodities, and cryptocurrencies.
Market Psychology Reflected
- Squeeze Phase: Traders are indecisive, volatility contracts, and price consolidates.
- Release Phase: Volatility expands, momentum builds, and strong directional moves occur.
- Bullish Histogram: Buyers dominate, pushing price upward with conviction.
- Bearish Histogram: Sellers take control, reflecting downward momentum.
This dynamic mirrors the buildup and release of market energy, offering traders insight into crowd behavior.
Analytical Considerations
- TTM is especially effective in breakout trading, as it identifies volatility compression zones.
- It is often paired with moving averages, RSI, MACD, or volume studies to confirm signals.
- Traders use it to anticipate explosive moves, reducing the risk of chasing trades after the breakout.
- In sideways markets, the squeeze condition helps avoid false entries by highlighting consolidation.
Contextual Importance
- Trend Confirmation: Aligns momentum direction with volatility expansion.
- Entry & Exit Guidance: Provides disciplined timing when squeezes release.
- Risk Awareness: Helps avoid premature trades by waiting for volatility expansion.
- Reversal Alerts: Weakening momentum in the histogram can signal potential turning points.
Final Insight
The TTM Indicator is a powerful blend of volatility and momentum analysis, offering traders a structured way to anticipate breakout opportunities. By identifying squeeze conditions and tracking momentum direction, it provides actionable insights for timing entries, exits, and managing risk. While it should not be used in isolation, combining TTM with trend‑following or volume‑based indicators enhances accuracy and confidence. For traders seeking a disciplined, volatility‑aware approach to market analysis, the TTM Indicator offers a reliable framework to navigate bullish and bearish markets effectively.