
The TrendLine Indicator is a technical analysis tool that automatically plots and updates trend lines based on price action. Unlike manually drawn lines, which can be subjective and time‑consuming, this indicator dynamically adjusts as new highs and lows form. It provides traders with a real‑time framework for identifying support and resistance zones, confirming breakout signals, and gauging the strength of ongoing trends.
Structural Components
The TrendLine Indicator is typically built using:
- Swing Highs & Lows: Detects pivot points in price movement.
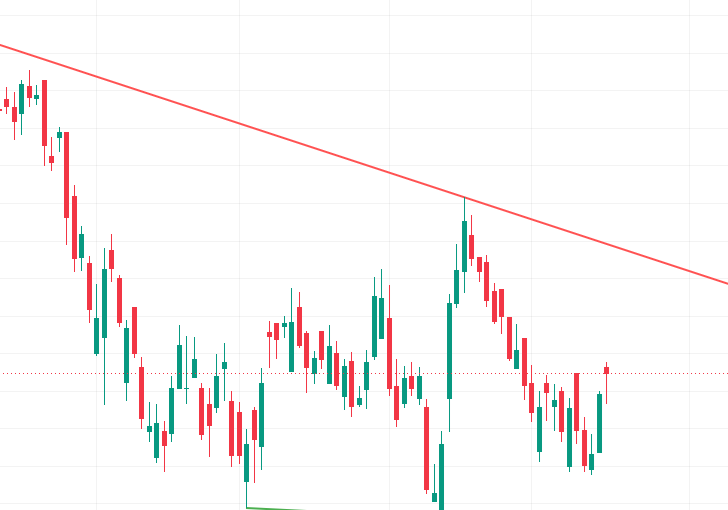
- Trend Line Calculation: Connects consecutive highs (for resistance) or lows (for support).
- Dynamic Updates: Adjusts automatically as new price data emerges.
- Breakout Signals: Highlights when price crosses above or below a trend line.
This structure ensures traders can visualize both short‑term and long‑term market direction without manually redrawing lines.
Distinctive Attributes
- Automatic Plotting: Eliminates subjectivity compared to manual drawing.
- Support & Resistance Mapping: Identifies critical levels where price often reacts.
- Breakout Detection: Signals potential entry points when price breaches a trend line.
- Noise Filtering: Focuses on meaningful pivots rather than minor fluctuations.
- Cross‑Market Utility: Works across equities, forex, commodities, and indices.
Market Psychology Reflected
- Price Above Trend Line: Indicates bullish conviction, with buyers pushing price higher.
- Price Below Trend Line: Suggests bearish sentiment, reflecting seller dominance.
- Failed Breakouts: Reveal weakening momentum or false signals.
- Sustained Breakouts: Confirm strong directional conviction among traders.
This dynamic mirrors the tug‑of‑war between buyers and sellers, offering clarity on crowd behavior.
Analytical Considerations
- TrendLine Indicators are trend‑sensitive, making them highly effective in directional markets.
- They are often combined with RSI, MACD, ATR, or Bollinger Bands to confirm signals.
- Particularly useful for systematic trading setups, where discipline and consistency are key.
- Customizable parameters allow traders to adapt the indicator to different assets and timeframes.
Contextual Importance
- Trend Confirmation: Validates whether the market is in an uptrend, downtrend, or sideways phase.
- Entry & Exit Guidance: Provides disciplined timing when price interacts with trend lines.
- Risk Awareness: Trend lines act as logical zones for stop‑loss placement.
- Reversal Alerts: Helps spot weakening momentum when price fails to break or hold trend lines.
Final Insight
The TrendLine Indicator is a powerful and adaptive tool that simplifies the process of tracking market direction. By automatically plotting trend lines, it eliminates subjectivity and provides traders with a clear framework for identifying trends, reversals, and breakout opportunities. Its ability to highlight support and resistance zones makes it invaluable for both short‑term and long‑term analysis. When paired with momentum or volume‑based indicators, TrendLine enhances accuracy and confidence, offering a disciplined approach to navigating bullish and bearish markets.