
The Support Resistance Trend Indicator is a structural analysis tool that highlights critical price levels where markets often pause, reverse, or accelerate. By combining historical swing points with directional tracking, it provides traders with a framework to understand market behavior beyond simple price movement. Support and resistance remain among the most fundamental concepts in technical analysis, and this indicator automates their detection while aligning them with prevailing momentum.
Structural Components
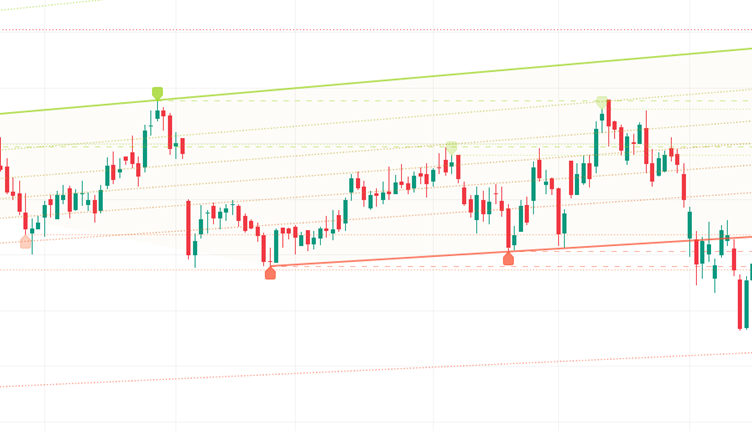
The Support Resistance Trend Indicator is built around key elements:
- Historical Swing Highs: Identify resistance levels where price previously peaked.
- Historical Swing Lows: Mark support zones where price found stability.
- Breakout Levels: Highlight points where price moves beyond established ranges.
- Directional Bias: Tracks whether the market is trending upward, downward, or sideways.
Conceptually:
- Resistance = Previous Swing High
- Support = Previous Swing Low
This structure ensures traders can visualize both protective floors and restrictive ceilings in price action.
Distinctive Attributes
- High Sensitivity: Reacts quickly to momentum changes, making it suitable for fast‑moving markets.
- Overbought & Oversold Detection: Identifies reversal zones where price may stall or reverse.
- Momentum Acceleration Analysis: Measures the pace of changes, offering deeper insight into strength or weakness.
- Interpolation Smoothing: Reduces random noise, improving readability of signals.
- Rapid Signal Generation: Captures quick market shifts before larger moves unfold.
- Cross‑Market Utility: Works across equities, forex, commodities, and indices.
Market Psychology Reflected
- Resistance Zones: Represent areas where sellers historically overpower buyers, creating ceilings.
- Support Zones: Act as floors where buyers step in to prevent further decline.
- Breakouts: Signal shifts in crowd sentiment, often leading to strong directional moves.
- Failed Breakouts: Reveal hesitation or lack of conviction among traders.
This dynamic mirrors the collective memory of market participants, showing how past reactions shape future expectations.
Analytical Considerations
- The indicator is structure‑focused, making it highly effective for understanding price behavior.
- It is often paired with oscillators (RSI, MACD) or volatility tools (ATR, Bollinger Bands) to confirm signals.
- Particularly useful for intraday and short‑term traders, who rely on precise levels for quick decisions.
- Customizable parameters allow adaptation to different assets and timeframes.
Contextual Importance
- Market Structure Clarity: Provides a framework for understanding how price interacts with historical levels.
- Risk Awareness: Helps traders place stop‑losses logically near support or resistance.
- Reversal Alerts: Detects weakening momentum when price fails to break or hold critical zones.
- Entry & Exit Guidance: Offers disciplined timing by highlighting key levels.
Final Insight
The Support Resistance Trend Indicator is a foundational tool that simplifies the process of identifying critical price zones and tracking directional bias. By mapping swing highs, swing lows, and breakout levels, it provides traders with a clear understanding of market structure. Its ability to highlight reversal zones, filter noise, and generate fast signals makes it indispensable for professional analysis. When combined with momentum or volatility‑based indicators, it enhances accuracy and confidence, offering a reliable framework to navigate both bullish and bearish conditions effectively.