
The Relative Vigor Index (RVGI) is a momentum‑based technical indicator designed to evaluate the conviction behind market trends. Unlike oscillators that rely solely on price changes, RVGI compares the closing price to the trading range over a selected period. The underlying principle is straightforward: in bullish conditions, prices tend to close near the high of the range, while in bearish conditions, they close near the low.
Interpolation enhancements further refine the indicator by reducing erratic fluctuations, creating smoother signals and improving clarity for traders.
Structural Components
The RVGI calculation is built on the relationship between price and range:
RVGI = {Close – Open}/{High – Low}
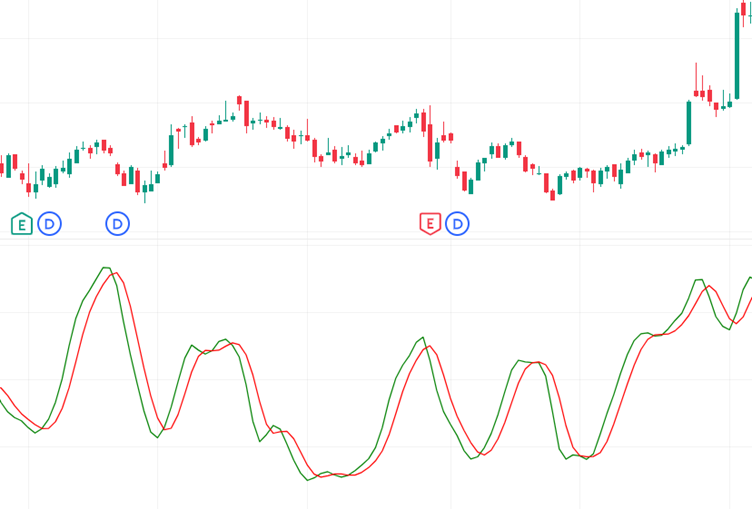
- Main RVGI Line: Represents the smoothed momentum reading.
- Signal Line: A secondary line used for crossover analysis.
- Interpolation Smoothing: Applied to stabilize movements and reduce noise.
Crossovers between the RVGI line and the signal line provide directional cues:
- RVGI Above Signal Line: Suggests strengthening bullish momentum.
- RVGI Below Signal Line: Indicates increasing bearish pressure.
Distinctive Attributes
- Conviction Measurement: Evaluates the strength behind price movements.
- Smooth Signal Generation: Reduces false triggers caused by volatility spikes.
- Momentum Confirmation: Validates whether trends are gaining or losing strength.
- Crossover Utility: Provides clear directional cues through line interactions.
- Divergence Detection: Highlights weakening trends when price and RVGI move in opposite directions.
- Multi‑Market Adaptability: Effective across equities, forex, commodities, and cryptocurrencies.
Market Psychology Reflected
- Bullish Crossovers: Indicate strong buying conviction and optimism.
- Bearish Crossovers: Suggest selling dominance and weakening sentiment.
- Stable RVGI Readings: Reflect confidence in prevailing market direction.
- Divergence Patterns: Reveal crowd hesitation when price continues in one direction but momentum fails to confirm.
This dynamic captures how traders perceive conviction in market moves, offering deeper insight into sentiment shifts.
Analytical Considerations
- RVGI is trend‑sensitive, making it effective for confirming directional strength.
- It is often paired with RSI, MACD, or moving averages to strengthen reliability.
- Particularly useful for swing traders and systematic models, where precision and stability are critical.
- Customizable parameters allow adaptation to different assets and timeframes.
Contextual Importance
- Momentum Validation: Confirms whether price action is supported by strong conviction.
- Reversal Alerts: Detects weakening momentum before price shifts occur.
- Noise Filtering: Provides smoother signals that reduce false entries.
- Decision Support: Enhances confidence by offering cleaner visualization of market direction.
Final Insight
The Relative Vigor Index is a sophisticated momentum indicator that blends price behavior with trading range analysis. Its ability to filter noise, highlight crossovers, and detect divergences makes it a reliable tool for evaluating trend strength. With interpolation smoothing improving clarity, RVGI helps traders focus on meaningful momentum shifts rather than reacting to every fluctuation. For those seeking consistency and precision in momentum analysis, RVGI offers a robust framework to interpret bullish and bearish conditions across multiple markets.