
Introduction
The Keltner Channel Indicator, introduced by Chester W. Keltner in the 1960s, is a volatility-based analytical tool that blends moving averages with the Average True Range (ATR). By creating dynamic price envelopes, it helps traders assess market conditions such as overbought or oversold zones, breakout potential, and overall trend direction. Its ability to expand and contract with volatility makes it particularly useful for swing traders and those following medium- to long-term trends.
Structural Composition
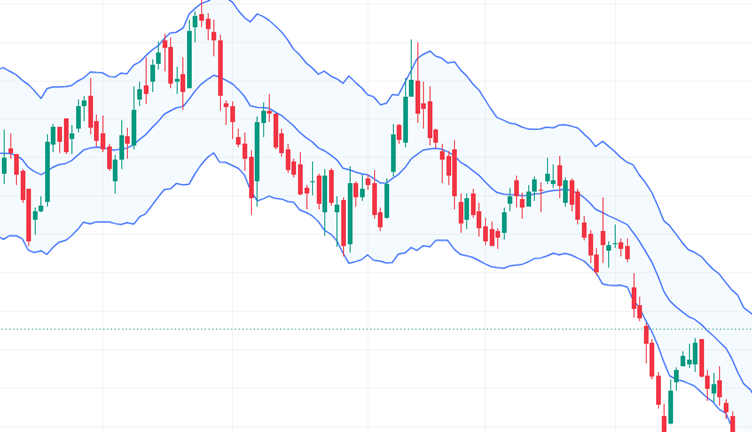
The Keltner Channel is built around three primary elements:
- Central Line → Typically an Exponential Moving Average (EMA) of closing prices.
- Upper Boundary → EMA plus ATR multiplied by a chosen factor (commonly 2).
- Lower Boundary → EMA minus ATR multiplied by the same factor.
- ATR Component → Measures volatility, ensuring the channel adapts to changing market conditions.
- Multiplier → Adjusts the width of the channel, allowing traders to fine-tune sensitivity.
This design ensures the channel widens during volatile phases and narrows when markets stabilize.
Distinctive Features
The Keltner Channel offers several qualities that make it a versatile tool:
- Volatility Adaptation → ATR ensures the channel responds dynamically to market shifts.
- Trend Clarity → Prices consistently above the EMA suggest bullish sentiment, while prices below indicate bearish bias.
- Breakout Identification → A close outside the channel often signals strong momentum.
- Smoother Action → Compared to Bollinger Bands, Keltner Channels provide a more refined view of price movement.
- Cross-Market Utility → Effective across equities, forex, commodities, and multiple timeframes.
Practical Applications for Traders
The indicator provides actionable insights in several ways:
- Momentum Tracking → Helps traders stay aligned with prevailing directional moves.
- Entry & Exit Discipline → Breakouts above or below the channel provide structured trade signals.
- Risk Management → Upper and lower bands act as dynamic support and resistance, guiding stop-loss placement.
- Reversal Awareness → When price re-enters the channel after a breakout, it may indicate weakening momentum.
- Layered Analysis → Works effectively when combined with oscillators like RSI or MACD for confirmation.
Why It Matters
The Keltner Channel is more than a volatility envelope—it is a trend and risk management framework. By adapting to market conditions, it allows traders to avoid false signals and focus on genuine momentum. Its smoother calculation compared to Bollinger Bands makes it particularly appealing for those seeking clarity in noisy markets.
Conclusion
The Keltner Channel Indicator blends moving averages with ATR to create adaptive price envelopes that highlight trends, breakouts, and reversals. Its versatility across timeframes and asset classes makes it suitable for both short-term and long-term traders. While best used in conjunction with other tools, its ability to filter noise and emphasize sustained momentum provides traders with a disciplined approach to volatility analysis. For those aiming to navigate bullish and bearish markets with confidence, the Keltner Channel remains a reliable and structured companion in technical analysis.