
Introduction
The KDJ Indicator is a momentum-based technical analysis instrument that evolved from the Stochastic Oscillator. Originating in China, it has gained popularity among traders for its ability to highlight overbought and oversold conditions while offering sharper insights into potential reversals. What sets KDJ apart is the addition of a third line—the J line—which enhances sensitivity to price changes and provides clearer signals for short-term trading decisions.
Structural Composition
The KDJ Indicator is built on a three-line framework:
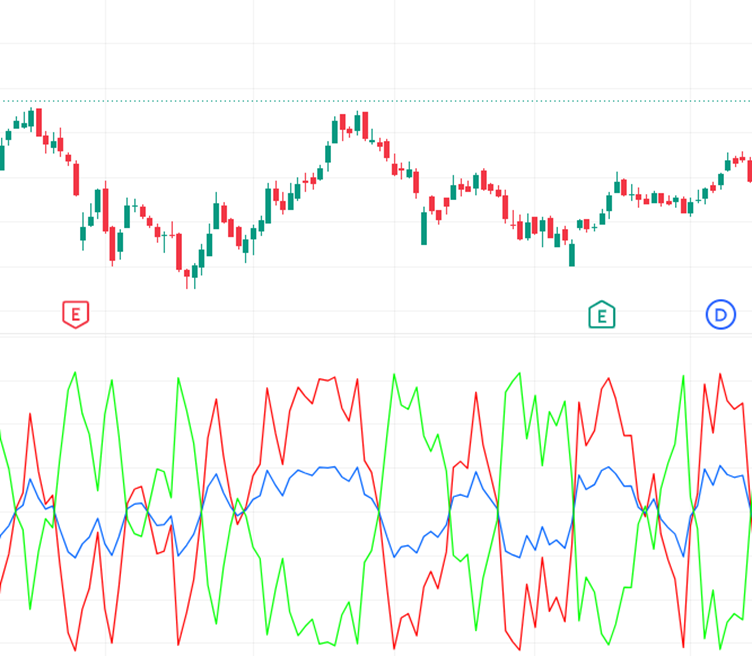
- %K Line → The fast stochastic line, calculated using price highs, lows, and closing values.
- %D Line → A smoothed moving average of %K, serving as the signal line.
- %J Line → A derived line that magnifies the gap between %K and %D, making the indicator more responsive.
The formula for the J line is:
J=3D−2K
This structure makes KDJ more sensitive than the standard Stochastic Oscillator, often producing earlier signals that traders can act upon.
Distinctive Features
The KDJ Indicator offers several unique qualities:
- Three-Line System → The J line adds an extra layer of responsiveness.
- Overbought/Oversold Zones → Readings above 80 suggest overbought conditions, while values below 20 indicate oversold markets.
- Crossover Triggers → Buy and sell signals emerge when %K crosses %D, with the J line amplifying the move.
- Versatility → Applicable across different timeframes and asset classes.
- Momentum Tracking → Highlights both the strength and direction of price movement.
Practical Benefits for Traders
The indicator provides actionable insights in multiple ways:
- Reversal Awareness → Sharp divergences in the J line often signal potential turning points.
- Disciplined Entries & Exits → Crossovers between %K and %D generate structured buy/sell signals.
- Risk Control → Helps traders avoid overextended positions by identifying overbought or oversold conditions.
- Trend Confirmation → When all three lines align, momentum strength is validated.
- Analytical Synergy → Works effectively alongside moving averages, MACD, or volume indicators for layered confirmation.
Why It Matters
The KDJ Indicator is not just a variation of the Stochastic Oscillator—it is a refined momentum framework. By adding the J line, it enhances sensitivity and provides earlier signals, making it particularly valuable for short-term traders who rely on quick decision-making. Its ability to highlight reversal zones and confirm momentum strength ensures that traders can navigate volatile markets with greater confidence.
Conclusion
The KDJ Indicator elevates the traditional Stochastic Oscillator by introducing the J line, which sharpens responsiveness and improves signal clarity. Its ability to detect overbought/oversold conditions, generate disciplined crossover signals, and highlight reversals makes it a powerful tool for momentum analysis. While best used in combination with other indicators, KDJ offers traders a structured and responsive framework to manage bullish and bearish market phases effectively.