
Introduction
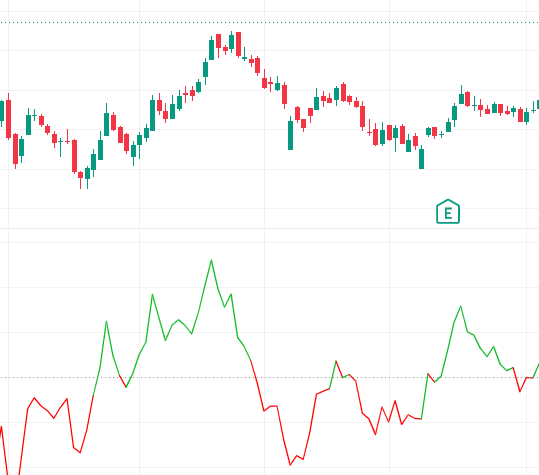
The Kairi Indicator is one of the earliest Japanese contributions to technical analysis, predating the more widely recognized Ichimoku system. The term Kairi translates to “disparity” or “difference,” reflecting its core function: measuring how far the current price deviates from its moving average. By quantifying this gap, the indicator helps traders recognize when prices are stretched too far in either direction, often signaling potential corrections or reversals. Although it is less commonly applied in modern trading, the Kairi Indicator remains a historically significant and practical tool for gauging market sentiment and equilibrium.
Structural Framework
The Kairi Indicator is calculated using a straightforward formula:
[ Kairi = \frac{(Current\ Price – Moving\ Average)}{Moving\ Average} \times 100 ]
- Current Price → Typically the closing price of the chosen period.
- Moving Average → Usually a simple moving average (SMA) over a selected timeframe.
- Kairi Value → Expressed as a percentage deviation from the moving average.
This structure makes it easy to identify when prices are unusually far from their average, often preceding a market correction.
Distinctive Features
The Kairi Indicator offers several defining characteristics:
- Deviation Measurement → Quantifies the extent of price divergence from its average.
- Overbought/Oversold Signals → Large positive readings suggest overbought conditions, while large negative values indicate oversold markets.
- Simplicity → Easy to compute and interpret without complex calculations.
- Versatility → Applicable across different timeframes and asset classes.
- Historical Importance → Serves as a foundation for later Japanese tools, including Ichimoku.
Benefits for Traders
The indicator provides practical advantages in trading analysis:
- Reversal Awareness → Highlights when prices are stretched too far, signaling potential corrections.
- Disciplined Entries & Exits → Helps traders time entries during oversold conditions and exits during overbought phases.
- Risk Control → Prevents traders from chasing prices that are already extended.
- Trend Validation → Confirms whether price movements are sustainable or likely to revert.
- Analytical Synergy → Works effectively when paired with oscillators such as RSI or MACD for layered confirmation.
Why It Matters
The Kairi Indicator is more than a historical curiosity—it is a sentiment gauge that provides insight into market equilibrium. By measuring disparity from the moving average, it allows traders to recognize unsustainable moves and anticipate corrections. Its simplicity makes it accessible, while its historical role underscores its importance in the evolution of Japanese technical analysis.
Conclusion
The Kairi Indicator remains a valuable tool for identifying overbought and oversold conditions by measuring price disparity from its moving average. Though modern traders often rely on advanced oscillators, Kairi continues to offer a straightforward way to anticipate reversals and corrections. When combined with trend-following or momentum indicators, it enhances accuracy and confidence. For traders seeking a historically significant yet practical method to understand price equilibrium, the Kairi Indicator provides a structured framework to navigate bullish and bearish markets effectively.