
Introduction
The Fractal Indicator, introduced by Bill Williams, is a technical analysis tool designed to identify potential reversal points in the market. Fractals are recurring price patterns that highlight areas of support and resistance, helping traders anticipate shifts in momentum. Widely used in forex, stocks, and commodities, the Fractal Indicator provides clarity on short-term structures within broader trends.
Structural Framework
The Fractal Indicator is based on a five-bar pattern:
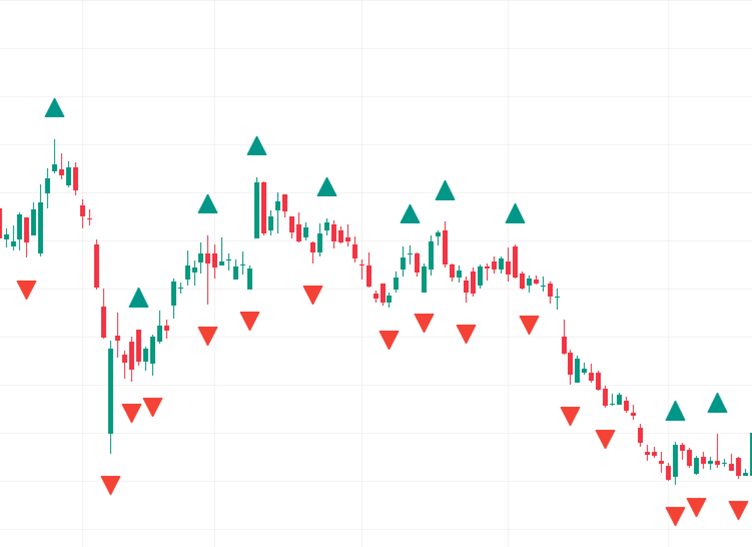
- Bullish Fractal (Buy Signal) → Occurs when the middle bar has the highest high, with two lower highs on either side.
- Bearish Fractal (Sell Signal) → Occurs when the middle bar has the lowest low, with two higher lows on either side.
- Visualization → Fractals are typically marked with arrows above or below candlesticks to highlight reversal points.
This simple structure makes fractals easy to spot and interpret, even for beginner traders.
Distinctive Features
The Fractal Indicator offers several unique qualities:
- Reversal Detection → Highlights potential turning points in price.
- Support & Resistance Mapping → Fractals often align with key levels.
- Trend Integration → Works best when combined with trend-following indicators like the Alligator or Moving Averages.
- Simplicity → Easy to interpret visually with arrows marking fractal points.
- Versatility → Applicable across multiple timeframes and asset classes.
Benefits for Traders
The indicator provides practical advantages in trading analysis:
- Entry & Exit Discipline → Offers clear signals for entering long or short positions.
- Trend Confirmation → Helps confirm whether a reversal aligns with broader market direction.
- Risk Control → Assists in setting stop-loss levels near fractal highs or lows.
- Breakout Awareness → Fractals often precede strong breakout moves.
- Analytical Synergy → Works well with momentum indicators like RSI or MACD for layered confirmation.
Why It Matters
The Fractal Indicator is more than just a reversal tool—it is a market structure framework. By identifying recurring five-bar patterns, it helps traders anticipate reversals, refine entries and exits, and map out support/resistance zones. Its simplicity makes it accessible, while its integration with other tools enhances accuracy.
Conclusion
The Fractal Indicator is a powerful reversal tool that highlights turning points and key levels in the market. Its five-bar structure makes it easy to use, while its synergy with trend-following and momentum indicators strengthens reliability. Though fractals should not be used in isolation, they provide valuable insights into market psychology and structure. For traders seeking to anticipate reversals and refine timing, the Fractal Indicator offers a disciplined framework to navigate bullish and bearish markets with confidence.