

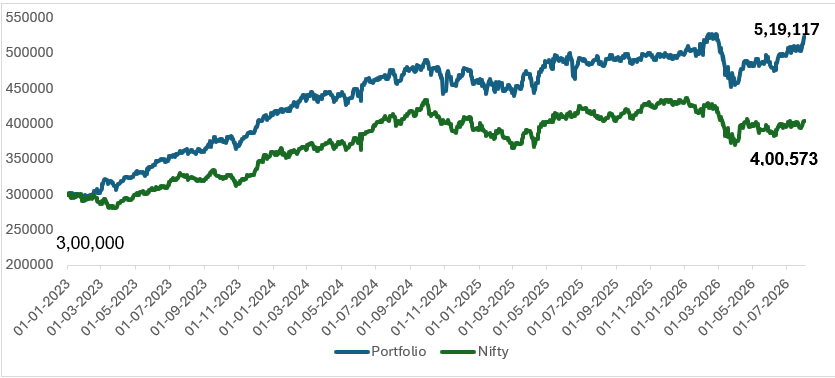
Picture a portfolio built entirely on numbers no instinct, no hunches, just a defined set of rules. That’s essentially what Velocity Vector is: a model portfolio strategy centered on momentum, targeting stocks that are already in motion, moving with conviction, and showing signals they have room to keep running.
This piece breaks down how the strategy is built and what it has delivered since launching on 1 January 2023, drawing on the August 2026 factsheet.
At a glance
- Strategy: High-Risk Equity | High-momentum Nifty 50 stocks with a volatility check
- Inception: 1 January 2023 | Rebalancing: Monthly
- Since-inception return: 73.04% vs. 33.06% (Nifty 50)
- Max drawdown: -3.35% | Min. investment: ₹3,00,000
What Exactly Is Velocity Vector?
Velocity Vector is a high-risk equity strategy built around high-momentum stocks from the Nifty 50, with a volatility check layered in to help keep risk in check. Put simply, it’s designed to capture strength in the market’s most actively moving large-cap names, while staying mindful of how sharply those names can swing.
⚠️ One thing to note upfront: this strategy isn’t built for any particular investor profile it’s a generic offering, not a customized one. The recommended minimum investment sits at ₹3,00,000, and on the risk scale, it lands firmly in “Very High Risk” territory.
What’s the Research Framework Behind It?
Instead of leaning on judgment calls, Velocity Vector runs on the RHOMB Technical Research Framework a proprietary system built entirely on rules. It’s made up of four main pieces:
| Component | What It Does |
|---|---|
| Price Boundary Model | Maps out a stock’s upper and lower price limits, signaling when it’s trading within a range or nearing a potential breakout |
| Momentum Strength Assessment | Scores each stock through a rule-based momentum measure, benchmarking its price action against peers to spot real strength |
| Rule-Driven Inclusion Criteria | Adds a stock to the portfolio only once it clears RHOMB’s set technical thresholds driven by pattern recognition and quantitative filters, never a judgment call |
| Constituent Weighting | Sets position sizes according to the model’s built-in rules, independent of any single investor’s circumstances or fit |
So, How Has It Actually Performed?
This is typically where people’s attention goes first, so here are the figures worth remembering that these numbers are illustrative and, as the factsheet notes, may reflect back-tested or hypothetical outcomes rather than real executed trades.
Had you put a hypothetical ₹3,00,000 in on 1 January 2023, here’s where it would stand today:
| Value Today | |
|---|---|
| Velocity Vector | ₹5,19,117 |
| Nifty 50 (benchmark) | ₹4,00,573 |
That translates to a since-inception holding period return of 73.04% for Velocity Vector, against 33.06% for the Nifty 50.
Here’s the period-by-period breakdown:
| Period | Velocity Vector CAGR | Velocity Vector HPR | Nifty 50 CAGR | Nifty 50 HPR |
|---|---|---|---|---|
| 6 Months | — | 0.13% | — | -4.32% |
| 1 Year | 5.24% | 5.24% | -2.17% | -2.17% |
| 3 Year | 12.55% | 42.58% | 7.42% | 23.95% |
| Since Inception | 16.55% | 73.04% | 8.31% | 33.06% |
Takeaway: In the most recent 6 months, the strategy stayed nearly flat (+0.13%) even as the Nifty 50 slipped into negative territory (-4.32%) a sign that even a momentum-focused portfolio can pull back or sit quiet when broader markets struggle. Zooming out, the longer time frames show steadier outperformance, though the -3.35% maximum drawdown is a useful reminder of how sharp the pullbacks can get.
How the Portfolio Is Allocated
The sector breakdown reveals a portfolio that’s concentrated rather than spread thin:
| Sector | Weightage |
|---|---|
| Financial Services | 58.41% |
| Fast-Moving Consumer Goods (FMCG) | 15.07% |
| Information Technology | 9.93% |
| Healthcare | 6.41% |
| Utilities / Power | 4.35% |
| Diversified | 3.14% |
| Materials / Commodities | 2.26% |
| Services | 0.42% |
Financial Services accounts for over half the portfolio on its own a natural outcome given how heavily financials feature in the Nifty 50 that this momentum strategy tracks. That said, it also means the portfolio’s outcomes are heavily dependent on how that single sector performs.
Zooming Out
Velocity Vector illustrates what rules-based, technically-driven investing looks like in practice there’s no story-chasing or forecasting involved, just a systematic process for spotting and weighting momentum. The since-inception figures point to outperformance against the Nifty 50 benchmark, though the quieter recent 6-month period and the concentrated sector exposure are good reminders that returns don’t move in a straight line and that a high-risk momentum approach can hit slow or rocky stretches even within a longer run of gains.
One more thing worth keeping in mind with model portfolios generally: the performance shown here rests on back-tested methodology, offers no guarantee for the future, and excludes brokerage or other costs. Anyone weighing this strategy should measure it against their own appetite for risk, given the “Very High Risk” label and the sizeable minimum investment required.
This article is based on the Velocity Vector August 2026 Model Portfolio Factsheet and is for informational purposes only. It is not investment advice.
Stay Informed, Stay Ahead
Markets move fast don’t miss the moves that matter. Get the latest global and Indian market news delivered straight to your inbox, before it becomes yesterday’s story.
Want to see exactly what’s inside Velocity Vector right now?
Explore the live holdings, weights, and latest rebalancing — no guesswork required.