General
Posted On: October 20, 2023
A Guide to Historical Stock Price Data
The stock market, often seen as a bustling hub of financial activity, has a rich history filled with remarkable events and stories of wealth creation and destruction. One way to delve into this history is by examining historical stock prices. By analyzing the movements of stock prices over time, investors, historians, and economists gain valuable insights into the past, understand market trends, and can even make informed predictions about the future. In this blog, we will take a journey through time to explore the historical prices of stocks, the tools and methods used to access this data, and the significance of studying stock price history.
I. Why Historical Stock Prices Matter:
- Market Trends and Patterns: Historical stock prices can reveal patterns and trends that help investors make informed decisions. Studying past performance can provide valuable insights into potential future movements.
- Economic and Social History: The stock market often reflects the economic and social history of a given period. For instance, stock prices crashed during the Great Depression, reflecting the broader economic turmoil of the time.
- Company Histories: Historical stock data allows us to trace the growth and development of companies over time. It’s like flipping through the pages of a corporate history book.
II. Analyzing Historical Stock Prices:
- Charting Tools: Candlestick charts, line charts, and bar charts are commonly used to visualize historical stock prices. These tools help identify trends, patterns, and support/resistance levels.
- Technical Analysis: Traders and investors use technical analysis indicators, such as moving averages, RSI, and MACD, to make predictions based on historical stock price data.
- Fundamental Analysis: Looking at historical price-to-earnings ratios (P/E ratios), earnings reports, and other fundamental data can help investors assess the true value of a stock over time.
III. Key Historical Stock Market Events:
- The Great Depression (1929): A catastrophic stock market crash that wiped out fortunes and triggered the Great Depression.
- Dot-Com Bubble (late 1990s): A speculative bubble in technology stocks that eventually burst, leading to a market crash.
- 2008 Financial Crisis: A global economic crisis caused by the collapse of major financial institutions and a housing market crash.
- COVID-19 Pandemic (2020): The pandemic caused extreme volatility in the stock market, leading to steep declines followed by a rapid recovery.
IV. Where can I Find Price History of the Stocks:
The Answer for your question is XCalData, Here you can find Price History, Stock Reports, Forecast, Strategies, Seasonality, Support and Resistance, Stop Loss, Trend, Target Price, Technical Ratios, Financial Ratios, and Many more.
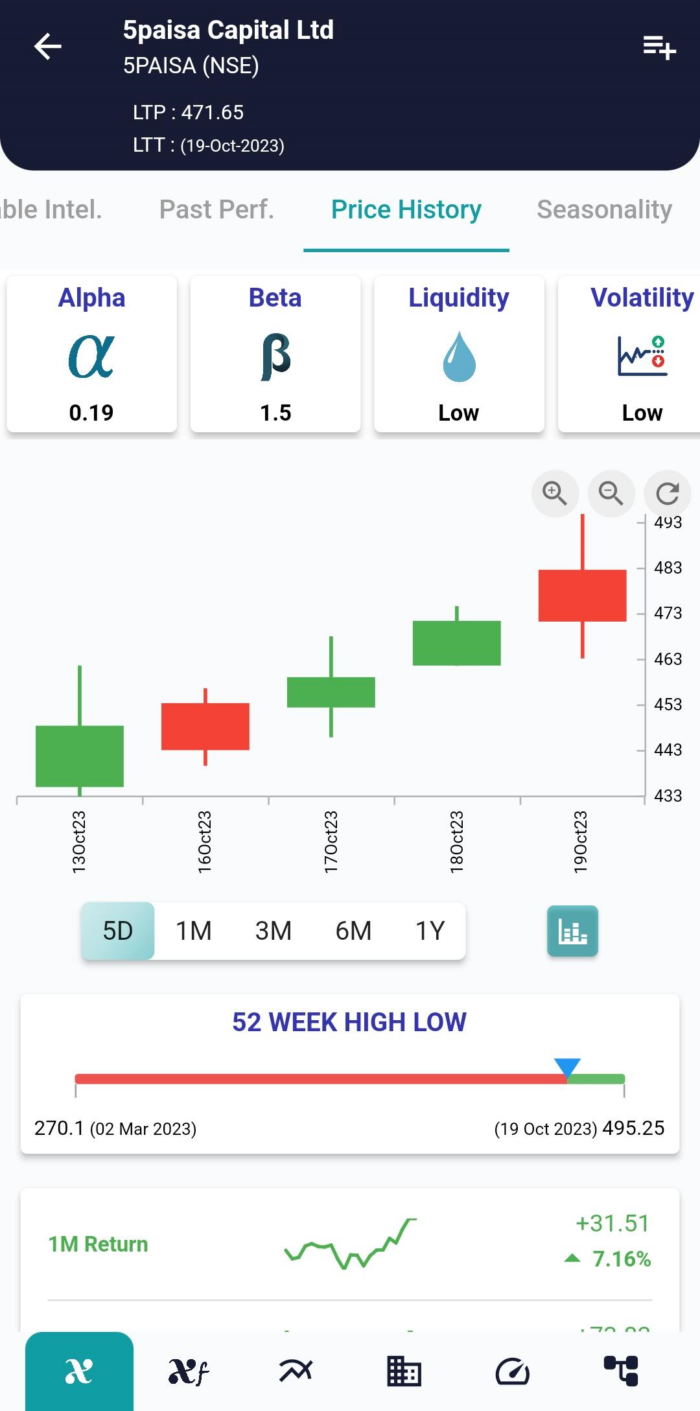
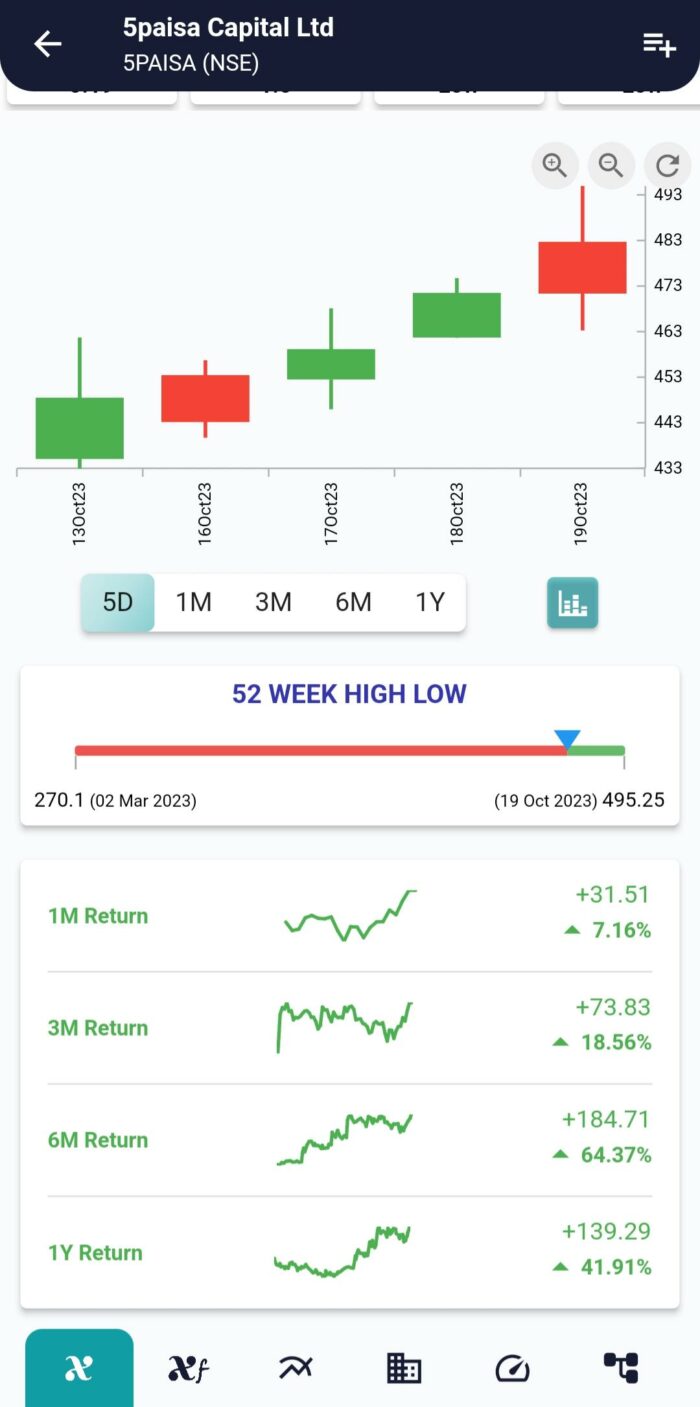
Here, In the Price History page you can able to see alpha, beta, Liquidity, Volatility, Sharp Ratio, Candle Stick Chart for 5Day, 1Month, 3Month, 6Month and 1Year, and Historical Return percentage and Price of the Stock for 1Month, 3Month, 6Month and 1Year.
V. Conclusion:
The historical prices of stocks provide a window into the past and a valuable resource for investors, historians, and economists. By studying historical stock data, we can gain insights into market trends, economic history, and the growth of companies. Accessing this data has become easier with the proliferation of financial websites and APIs, and analyzing it can be done through various charting and analysis tools. From the Great Depression to the dot-com bubble and beyond, historical stock prices reveal a rich tapestry of financial events that have shaped our world.
Whether you’re a seasoned investor or simply interested in the history of finance, exploring historical stock prices is a fascinating journey through the highs and lows of the market, and it offers valuable lessons for the future.
xCalData provides a valuable resource for anyone interested in the stock market. Download the app from google play.
For Actionable Intelligence, subscribe to xCalData app on Android devices: https://tinyurl.com/downloadxCalData
Popular Posts
-
Stock of Interest . August 23, 2024
#HSCL (NSE) Stock Report | 23 Aug 2024
-
Stock of Interest . August 23, 2024
Add Zerodha trading account to xCalData
-
Stock of Interest . August 23, 2024
What is xCalData , how to use it and how accurate is it?
-
Stock of Interest . August 23, 2024
Jurik Moving Average (JMA): A Profit Trading Insight