Technical Indicator
Posted On: January 30, 2024
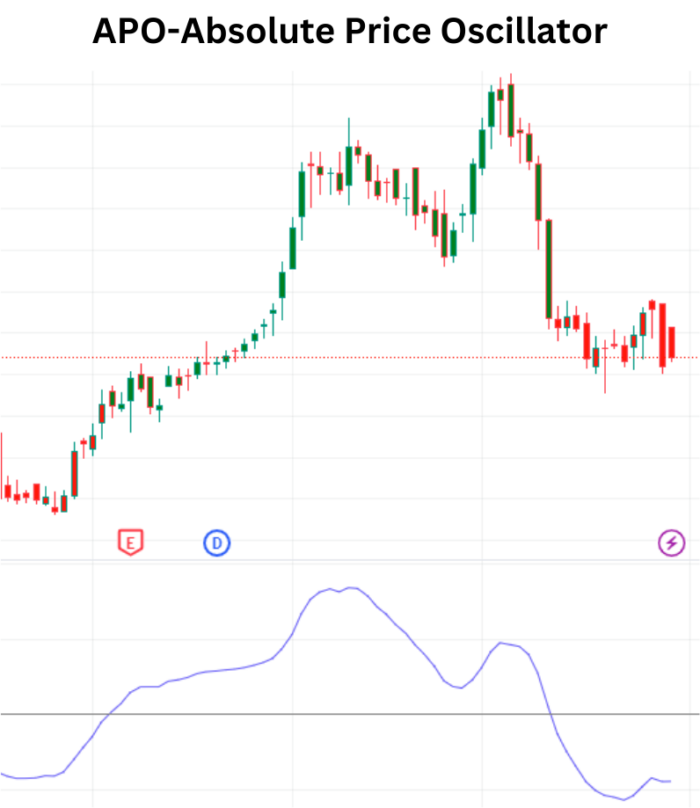
Absolute Price Oscillator (APO) : Analyzing Trends with Precision
In the realm of financial analysis, traders and analysts rely on various technical indicators to discern market trends and potential trading opportunities. One such powerful tool is the APO Absolute Price Oscillator technical indicator , designed to measure the difference between two moving averages of a security’s price. In this blog post, we explore the mathematical formula, interpretation, and practical applications of the APO to empower traders in their decision-making process.
Mathematical Formula for APO:
The APO is calculated by subtracting a longer-term Exponential Moving Average (EMA) from a shorter-term EMA. The formula is expressed as follows:
AbsolutePriceOscillator_Value=EMA of close (shorter-term)−EMA of close (longer-term)AbsolutePriceOscillator_Value=EMA of close (shorter-term)−EMA of close (longer-term)
Here, the choice of EMA periods depends on the trader’s preferences and the time frame being analyzed. Common combinations include the 10-day and 20-day EMAs, providing flexibility for adaptation to different market conditions.
Interpretation for APO:
The APO offers valuable insights through zero-line crossovers and divergence patterns.
Zero-line Crossover:
- Bullish Signal: When the APO is crossing the 0 value on the way up, the corresponding value in ‘AbsolutePriceOscillator_Crossover’ is assigned as Bullish. This indicates potential upward momentum in the market.
- Bearish Signal: Conversely, when the APO is crossing the 0 value on the way down, the corresponding value in ‘AbsolutePriceOscillator_Crossover’ is assigned as Bearish. This suggests potential downward pressure in the market.
- Neutral Signal: If the APO is not crossing the 0 value, the corresponding value in ‘AbsolutePriceOscillator_Crossover’ is assigned as Neutral. This implies a lack of clear directional bias.
Divergence:
- Bullish Divergence: Formed when prices make a lower low, but the APO forms a higher low. This indicates less downward momentum, signaling a potential Buy.
- Bearish Divergence: Formed when prices make a higher high, but the APO forms a lower high. This signals less upward momentum, indicating a potential Sell. Otherwise, it suggests a Hold signal.
Practical Applications:
- Trend Identification: APO assists traders in identifying trends by highlighting the difference between short-term and long-term EMAs. Positive values indicate potential bullish trends, while negative values suggest bearish trends.
- Entry and Exit Points: Zero-line crossovers serve as entry and exit signals, helping traders make timely decisions based on changes in momentum.
- Divergence Analysis: Bullish and bearish divergences provide additional confirmation for potential trend reversals or continuations.
Conclusion:
Incorporating the Absolute Price Oscillator into a trader’s toolkit enhances the ability to analyze trends and make informed decisions. Whether identifying crossovers, analyzing divergences, or gauging overall market momentum, the APO proves to be a versatile and valuable indicator. Traders can leverage its signals to navigate the complexities of financial markets with precision and confidence.
xCalData is an exceptional app available for Android devices that offers unbiased insights into stocks, allowing investors to make informed decisions. With its user-friendly interface and comprehensive features, xCalData provides a valuable resource for anyone interested in the stock market. Download the app from google play.
For Actionable Intelligence, subscribe to xCalData app on Android devices: https://tinyurl.com/downloadxCalData
Popular Posts
-
Stock of Interest . August 23, 2024
#HSCL (NSE) Stock Report | 23 Aug 2024
-
Stock of Interest . August 23, 2024
Add Zerodha trading account to xCalData
-
Stock of Interest . August 23, 2024
What is xCalData , how to use it and how accurate is it?
-
Stock of Interest . August 23, 2024
Jurik Moving Average (JMA): A Profit Trading Insight