Technical Indicator
Posted On: January 31, 2024
Boost Your Trading with the Chande Momentum Oscillator
Decoding Chande Momentum Oscillator
The Chande Momentum Oscillator, introduced by Tushar Chande in 1994, is a powerful technical indicator designed to identify relative strength or weakness in a market. Unlike traditional indicators, the Chande oscillator calculates the difference between recent gains and losses, providing a dynamic perspective on momentum. Lets see this CMO Indicator Formula, Interpretations by using xCaldata App.
The Formula Unveiled
The formula encapsulates the essence of momentum analysis:
Chande Momentum Oscillator=(sH + sL / sH−sL)×100
Here,
- sH represents the sum of higher closes over N periods.
- sL represents the sum of lower closes over N periods.
- N-Number of Periods (Default: 14)
Step-by-Step Calculation Guide
- Sum of Higher Closes: Calculate the sum of higher closes over N periods.
- Sum of Lower Closes: Calculate the sum of lower closes over N periods.
- Compute the Difference: Subtract the sum of lower closes from the sum of higher closes.
- Compute the Sum: Add the sum of lower closes to the sum of higher closes.
- Final Oscillator Value: Divide step 3 by step 4, multiply by 100.
Key Insights into Chande Momentum Oscillator
Sensitivity to Time Frame
The chosen time frame significantly influences the signals generated by the Chande Momentum Oscillator. Traders must carefully select the period to align with their analytical objectives.
Pattern Recognition Superiority
Pattern recognition often yields more reliable signals than absolute oscillator levels. Traders should leverage the Chande oscillator in conjunction with trend analysis for a comprehensive approach.
Market Trend Impact
In strongly trending markets, overbought-oversold indicators, including the Chande Momentum Oscillator, may be less effective. Traders need to adapt their strategies based on market conditions.
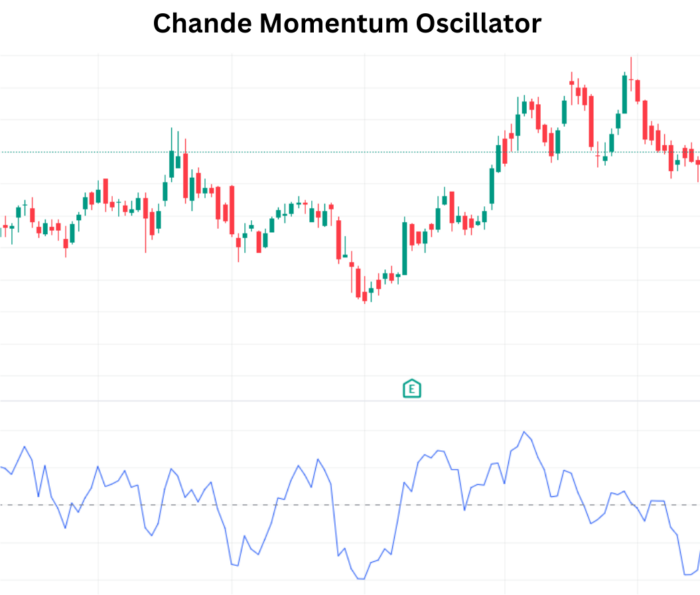
Interpreting Chande Momentum Oscillator
The oscillator oscillates between +100 and -100, providing valuable insights:
- Overbought Conditions: Chande Momentum Oscillator above +50.
- Oversold Conditions: Chande Momentum Oscillator below -50.
Many traders incorporate a 10-period moving average as a signal line. A bullish signal emerges when the oscillator crosses above the moving average, while a bearish signal appears when it drops below.
- If the value of Chande Momentum Oscillator Value is greater than the OVERBOUGHT then this is Strong Bullish.
- If the value of Chande Momentum Oscillator Value is greater than 0 and less than or equal to ‘OVERBOUGHT’, then its ‘Bullish‘.
- If the value of Chande Momentum Oscillator Value is less than 0 and greater than or equal to -50, then its ‘Bearish‘.
- If none of the above conditions are met, i.e., if the value of Chande Momentum Oscillator Value is less than -50, the corresponding value then ‘Strong Bearish‘.
Strengthening Strategies with Chande Momentum Oscillator
- Confirmation Signal: Use the oscillator as a confirmation signal when it crosses above or below the 0 line, enhancing the reliability of trend predictions.
- Moving Average Integration: Combine the oscillator with moving averages for more nuanced signals, especially during crossovers like the golden cross (50-day crossing above 200-day).
- Trend Strength Measurement: Assess trend strength using the oscillator’s value, providing a gauge for the robustness of expected trends.
In Conclusion
The Chande Momentum Oscillator serves as a valuable ally for traders navigating the complexities of market momentum. Its dynamic calculations and sensitivity to trend changes make it a versatile tool in the technical analysis arsenal. By understanding its nuances and integrating it strategically, traders can gain a deeper understanding of market dynamics and make more informed decisions.
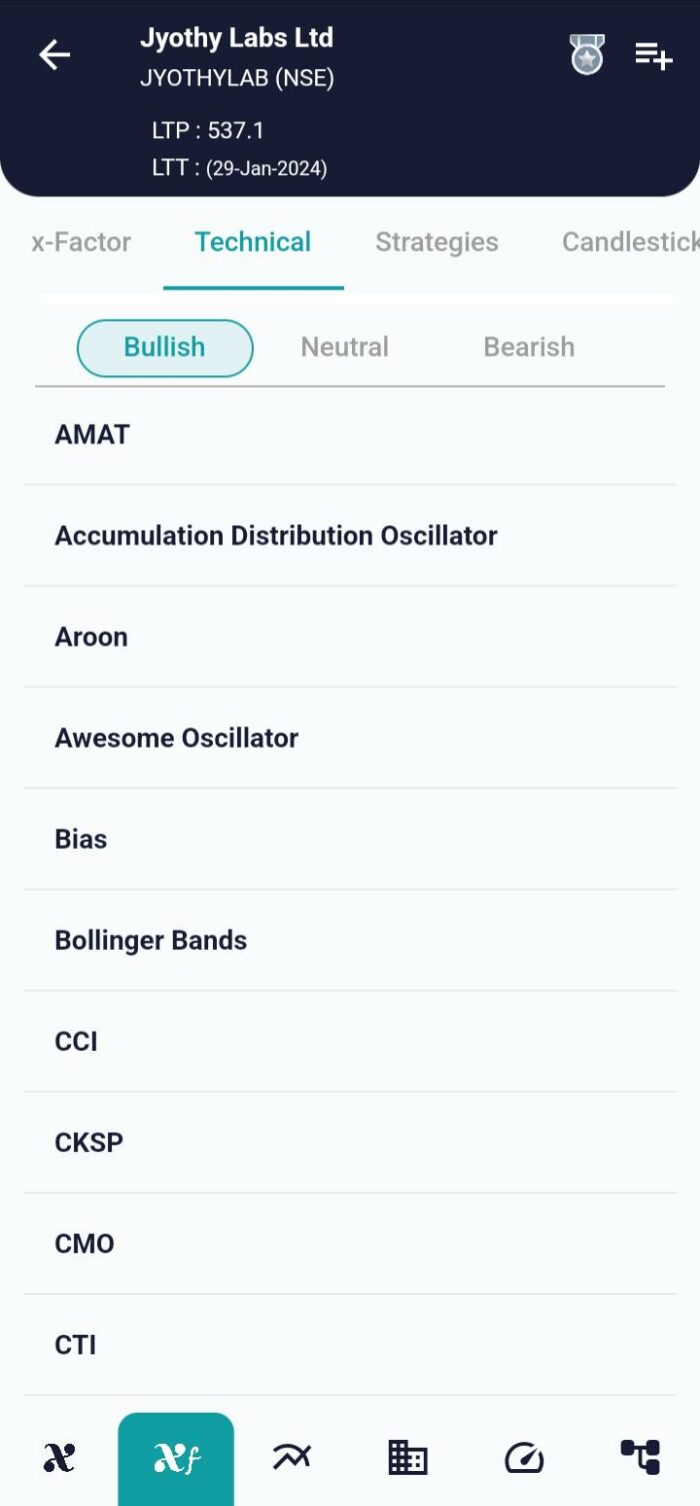
xCalData is an exceptional app available for Android devices that offers unbiased insights into stocks, allowing investors to make informed decisions. With its user-friendly interface and comprehensive features, xCalData provides a valuable resource for anyone interested in the stock market. Download the app from google play.
For Actionable Intelligence, subscribe to xCalData app on Android devices: https://tinyurl.com/downloadxCalData
Popular Posts
-
Stock of Interest . August 23, 2024
#HSCL (NSE) Stock Report | 23 Aug 2024
-
Stock of Interest . August 23, 2024
Add Zerodha trading account to xCalData
-
Stock of Interest . August 23, 2024
What is xCalData , how to use it and how accurate is it?
-
Stock of Interest . August 23, 2024
Jurik Moving Average (JMA): A Profit Trading Insight