Candlestick Pattern
Posted On: August 30, 2023
Bullish Harami Cross: A Beacon of Potential Reversals in Trading
A Comprehensive Manual for Traders:
Within the intricate landscape of financial markets, traders employ a wide range of technical analysis tools to decipher potential trend reversals and market dynamics. Candlestick patterns, known for their ability to provide actionable insights, play a crucial role in this endeavor. The Bullish Harami Cross pattern is one such candlestick pattern that holds significance for traders as it signals potential bullish reversals. In this blog post, we will explore the concept of the Bullish Harami Cross pattern, delve into its identification process, and discuss how traders can interpret this pattern to enhance their trading strategies.
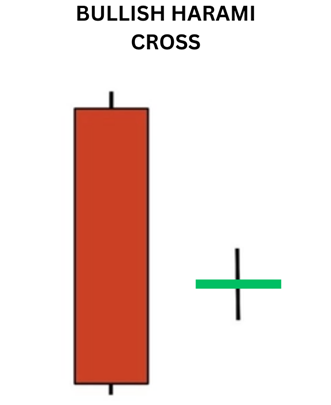
The Bullish Harami Cross pattern is a two-candlestick formation that often materializes at the end of a downtrend. It suggests that the bears’ control might be weakening, potentially leading to a bullish reversal. The pattern consists of a long bearish candlestick followed by a smaller bullish candlestick, where the latter’s body lies within the range of the bearish candlestick. Additionally, the bullish candlestick features a doji, signifying market indecision.
Identifying the Bullish Harami Cross Pattern:
To identify the Bullish Harami Cross pattern, traders should pay close attention to the following key features:
- Downtrend: The pattern emerges within an ongoing downtrend, indicating potential bullish reversal.
- Long Bearish Candlestick: The first candlestick is bearish and signifies prevailing selling pressure in the market.
- Small Bullish Candlestick: The second candlestick is bullish, with its body residing within the range of the bearish candlestick.
- Doji Candlestick: The bullish candlestick features a doji, where the opening and closing prices are nearly identical, highlighting market indecision.
Interpreting the Bullish Harami Cross Pattern:
The Bullish Harami Cross pattern implies that the bears’ dominance may be waning, and buyers are potentially gaining control, leading to a trend reversal. It suggests a shift in market sentiment from bearish to bullish. Traders interpret this pattern as a signal to consider initiating long positions or tightening stop-loss levels on existing short positions.
Confirmation and Trade Execution:
While the Bullish Harami Cross pattern provides a potential bullish signal, traders often seek supplementary confirmation before entering trades. They may consider the following factors:
- Volume Confirmation: Higher trading volume during the pattern’s formation enhances the credibility of the potential reversal.
- Support and Resistance Levels: Identifying key support and resistance levels can further validate the pattern’s authenticity and guide in setting realistic price targets.
- Technical Indicators: Integrating the Bullish Harami Cross pattern with other technical indicators, such as moving averages or oscillators, enriches the trading decision-making process.
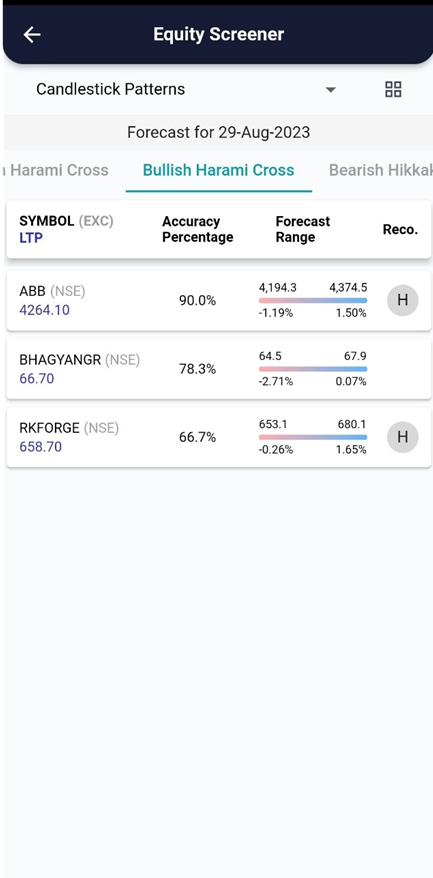
xCalData analyses the candles of individual stocks daily and identifies the stocks forming various patterns. Checkout xCalData app to know all the candle stick patterns formed by the stock of your interest.
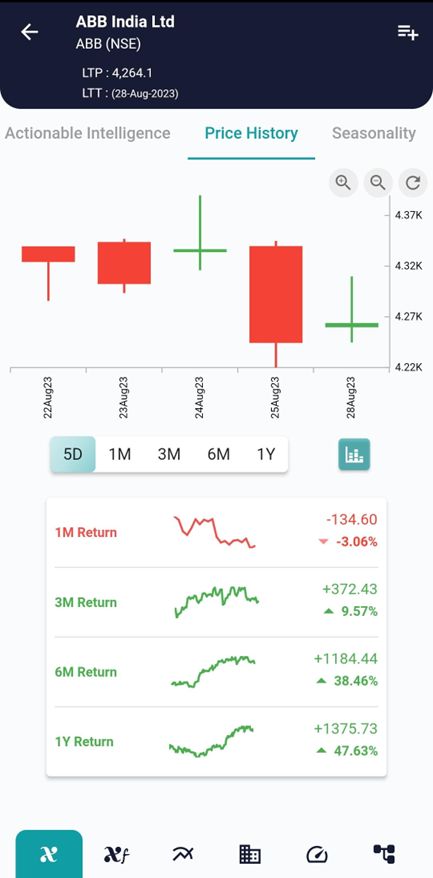
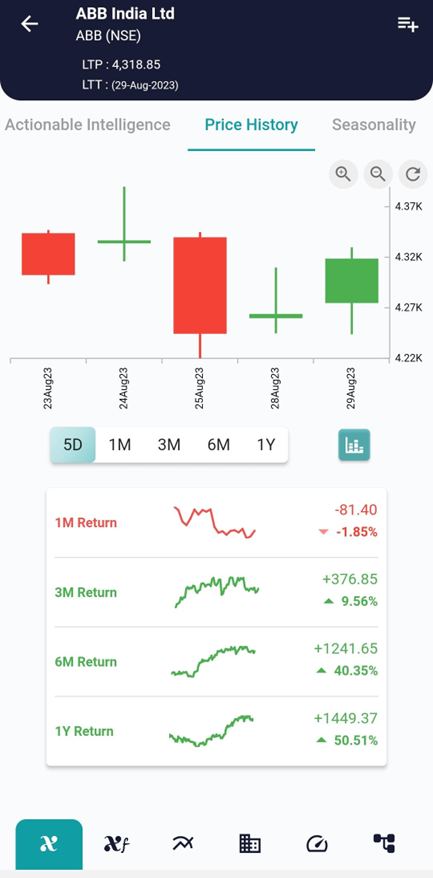
Example, on 28 Aug the stock showed the Bullish Harami cross pattern and on 29 Aug the stock started going up as can be seen in the interpretation above.
Conclusion:
The Bullish Harami Cross pattern serves as a valuable tool for traders, offering insights into potential bullish reversals and shifts in market sentiment. By understanding its identification process and adeptly interpreting this pattern, traders can refine their trading strategies.
However, it’s vital to recognize that no pattern guarantees success, and informed trading decisions necessitate additional verification and comprehensive analysis.
Trading always involves risk, and it is crucial to develop a well-rounded trading strategy, including risk management techniques, to increase your productivity and achieve long-term success in the financial markets, Visit and download xCalData.
Where can I see further insights on this stock?
xCalData offers unbiased insights into stocks. Download the app from google play. For Actionable Intelligence, subscribe to xCalData app on Android devices: Download here

Disclaimer: The securities quoted are for illustration only and are not recommendatory.
Popular Posts
-
Stock of Interest . August 23, 2024
#HSCL (NSE) Stock Report | 23 Aug 2024
-
Stock of Interest . August 23, 2024
Add Zerodha trading account to xCalData
-
Stock of Interest . August 23, 2024
What is xCalData , how to use it and how accurate is it?
-
Stock of Interest . August 23, 2024
Jurik Moving Average (JMA): A Profit Trading Insight