Market report
Posted On: June 24, 2022
CGCL – stock of interest 24 Jun 2022
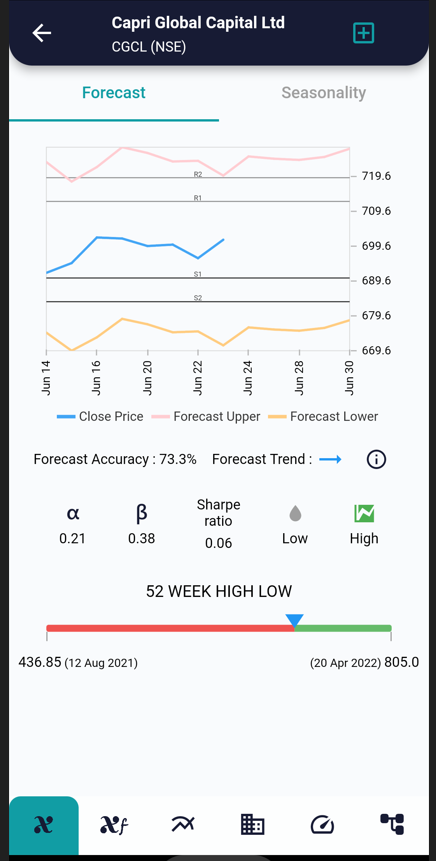
xCalData forecasts the prices for next 5 days between 679 and 720.
The low alpha indicates stock is performing in line with the sector.
Beta less than 1 means stock is less volatile compared to market.
The stock price is above the midway between the 52-week low and high
indicating it is likely on upward trajectory.
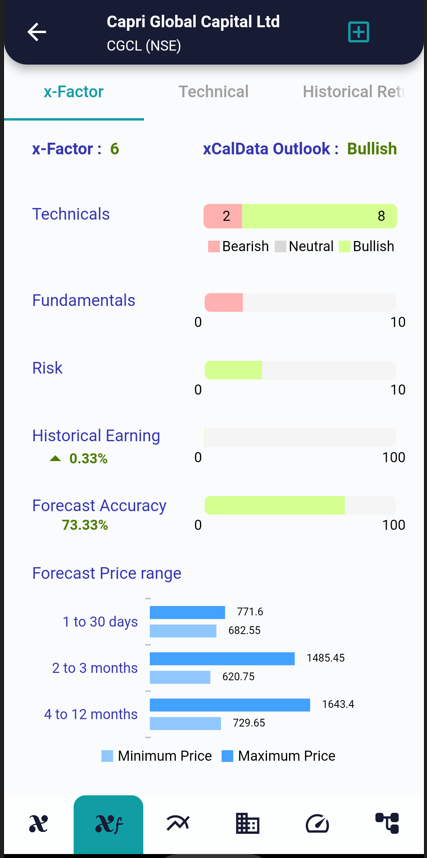
xFactor is a Proprietary score xCalData provides for each stock.
xFactor is 6 and xFactor Outlook is Bullish.
The forecast price range for various time horizons is shown in the graph as well .
Historical forecast accuracy is 73%.
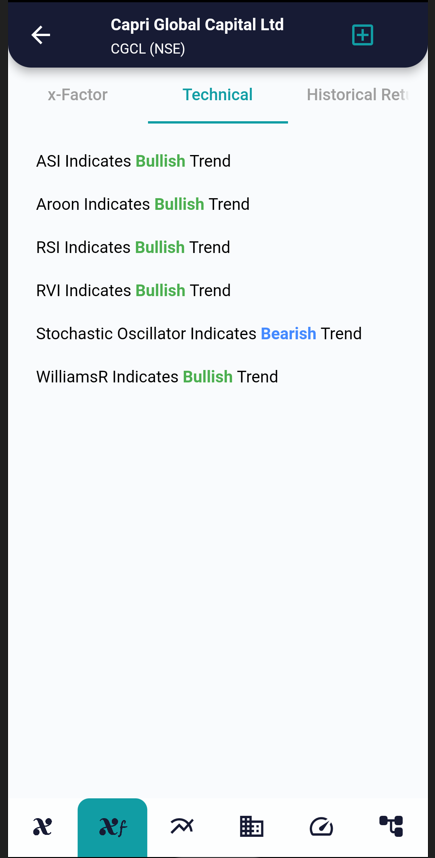
Reviewing the list of technical indicators, we see all the ratios
show a bullish trend.
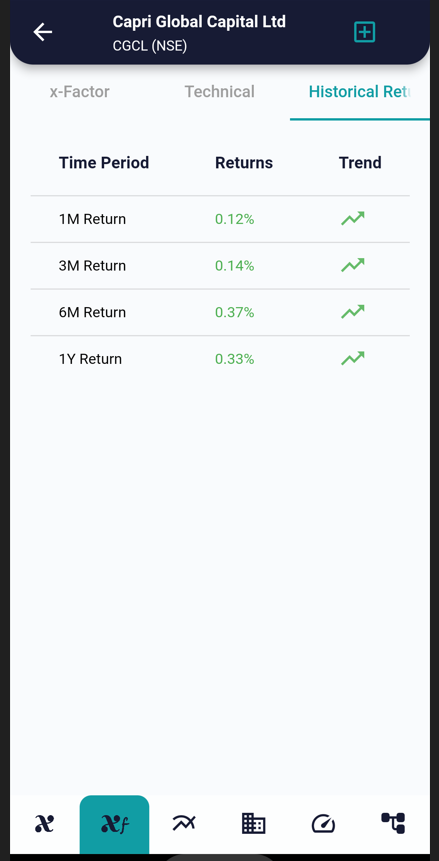
Returns in all time frames within past 1 year have been positive.
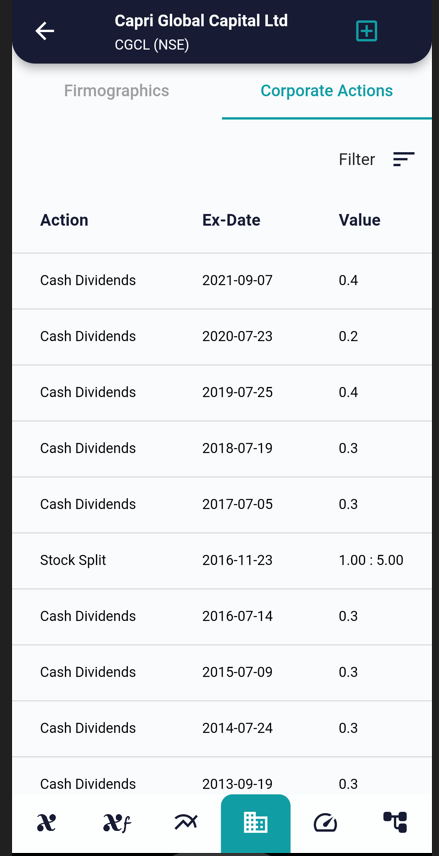
Stock has given a consistent annual dividend in the past.
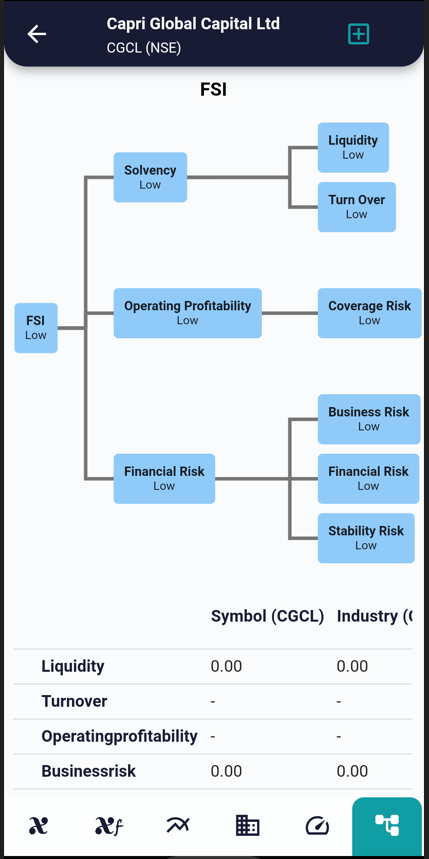
FSI is a proprietary view of xCalData to review the
fundamentals of the stock quickly.
Stock has a “LOW” FSI score contributed by low operating profit.
Popular Posts
-
Stock of Interest . August 23, 2024
#HSCL (NSE) Stock Report | 23 Aug 2024
-
Stock of Interest . August 23, 2024
Add Zerodha trading account to xCalData
-
Stock of Interest . August 23, 2024
What is xCalData , how to use it and how accurate is it?
-
Stock of Interest . August 23, 2024
Jurik Moving Average (JMA): A Profit Trading Insight