Technical Indicator
Posted On: January 31, 2024
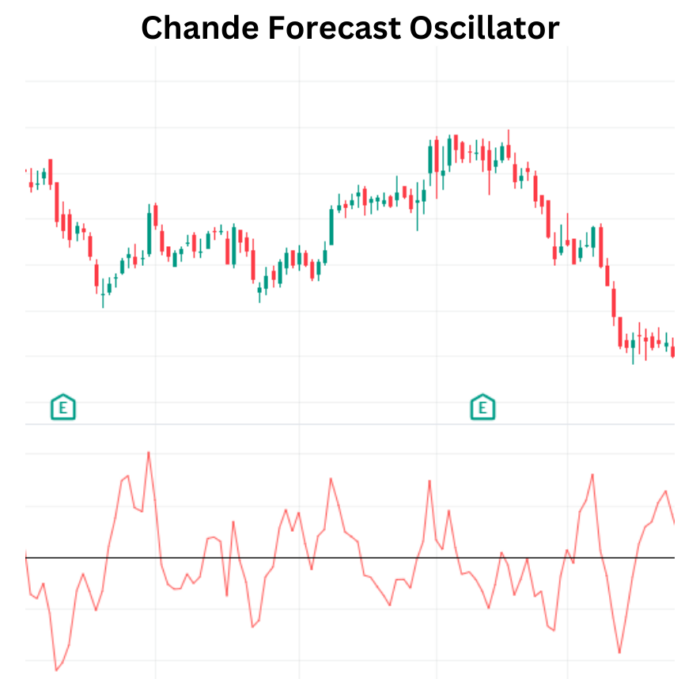
Chande Forecast Oscillator (CFO) – A Successful Trend Identifier
In the fast-paced realm of financial markets, traders seek tools that provide insights into potential trend reversals and market dynamics. One such technical indicator , the Chande Forecast Oscillator (CFO), offers a unique perspective by analyzing the percentage difference between closing prices and n-period linear regression forecasted prices. In this blog post, we will explore the intricacies of CFO, understand its mathematical foundation, and unravel the valuable information it provides for traders.
Understanding Chande Forecast Oscillator (CFO)
Developed to gauge the percentage difference between the closing price and the forecasted price through linear regression, the Chande Forecast Oscillator is a technical indicator that aids traders in making informed decisions. Dr. Tushar Chande, a prominent technical analyst, introduced this oscillator to offer a comprehensive view of market trends.
Mathematical Foundation
The CFO’s mathematical foundation lies in linear regression, a statistical method that models the relationship between two variables. The formula for calculating the linear regression forecast involves determining the slope (m) and intercept (b) using the least squares method. Once these values are obtained, the linear regression forecast is expressed as slope * length + intercept.
The Chande Forecast Oscillator (CFO) is then calculated using the formula:
CFO = (Close −Linear Regression) ×100/Close
where linear regression is calculated as ?
slope=m=∑ni=1(xi−x¯)(yi−y¯)/∑ni=1(xi−x¯)2
intercept=b=y¯−mx¯
Linear Regression=slope*length +intercept
Here, the linear regression is obtained through the slope, intercept, and length, reflecting the statistical projection of future prices.
Interpreting CFO Values
The CFO provides crucial information based on its values:
- Above Zero: When the CFO is above zero, it signifies that the forecasted price (through linear regression) is greater than the closing price. This condition suggests potential bullish sentiment in the market.
- Below Zero: Conversely, when the CFO is below zero, it indicates that the forecasted price is less than the closing price. This situation implies potential bearish sentiment in the market.
Zero-Line Crossover Signals
The zero-line crossover is a pivotal aspect of interpreting Chande Forecast Oscillator signals:
- CFO Crossing Above 0: A signal to buy is generated when the CFO crosses above the zero value. This suggests a potential upward trend in the market.
- CFO Crossing Below 0: Conversely, a signal to sell is generated when the CFO crosses below the zero value. This indicates a potential downward trend in the market.
- CFO Not Crossing 0: When the CFO is not crossing the zero value, it is interpreted as a hold signal. Traders may choose to maintain their current positions, anticipating further market developments.
Incorporating CFO into Trading Strategies
Traders can leverage the Chande Forecast Oscillator in their strategies:
- Buy Opportunities: Look for CFO crossing above 0 as a potential buy signal, signaling a bullish trend.
- Sell Opportunities: Conversely, CFO crossing below 0 can be considered a sell signal, indicating a bearish trend.
Conclusion
In the dynamic world of trading, having tools that offer insights into market sentiment is invaluable. The Chande Forecast Oscillator provides a unique perspective by incorporating linear regression forecasts into its analysis. Traders can use CFO signals in conjunction with other technical indicators to make well-informed decisions.
In conclusion, the Chande Forecast Oscillator is a valuable addition to a trader’s toolkit, offering a nuanced view of market trends. As with any technical analysis tool, it’s crucial to consider multiple factors and use CFO in conjunction with other indicators for comprehensive market analysis.
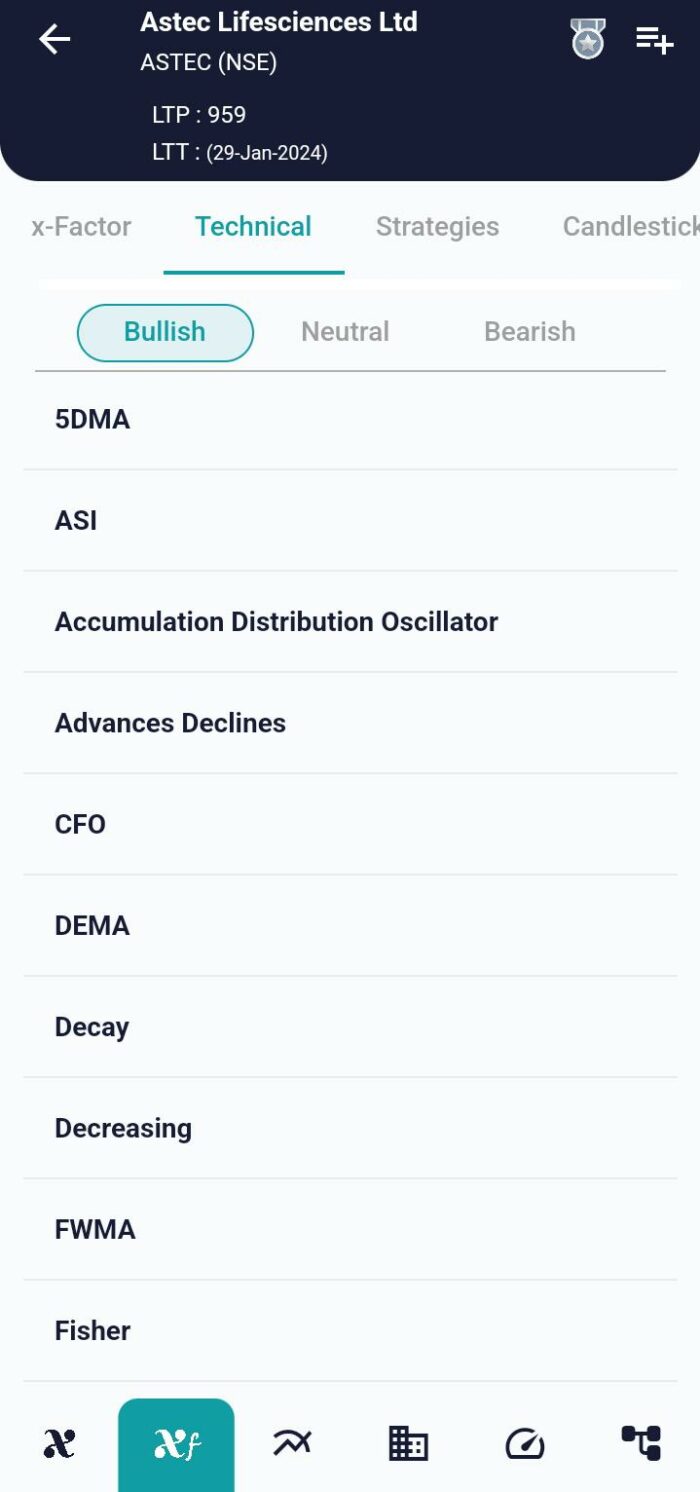
xCalData is an exceptional app available for Android devices that offers unbiased insights into stocks, allowing investors to make informed decisions. With its user-friendly interface and comprehensive features, xCalData provides a valuable resource for anyone interested in the stock market. Download the app from google play.
For Actionable Intelligence, subscribe to xCalData app on Android devices: https://tinyurl.com/downloadxCalData
Popular Posts
-
Stock of Interest . August 23, 2024
#HSCL (NSE) Stock Report | 23 Aug 2024
-
Stock of Interest . August 23, 2024
Add Zerodha trading account to xCalData
-
Stock of Interest . August 23, 2024
What is xCalData , how to use it and how accurate is it?
-
Stock of Interest . August 23, 2024
Jurik Moving Average (JMA): A Profit Trading Insight