Technical Indicator
Posted On: January 31, 2024
Chande Kroll Stop for Mastering Risk Management in Stock Market
Unveiling the Chande Kroll Stop Indicator
Introduced by Tushar Chande and Stanley Kroll in their 1994 book, “The New Technical Trader – Boost Your Profit by Plugging into the Latest Indicators,” the Chande Kroll Stop is a powerful technical indicator designed to empower traders in effectively managing risk associated with their positions. By incorporating the Average True Range (ATR), this indicator ensures that stop loss levels are dynamically adjusted based on an asset’s volatility, providing a robust risk management strategy.
The Chande Kroll Stop Formula
The Chande Kroll Stop involves a multi-step calculation to determine optimal stop levels:
Initial High Stop=HIGHEST[p](high)−x * Average True Range
Initial Low Stop=LOWEST[p](low)+x * Average True Range
Short stop = highest value within the last q periods of the initial high stop.
Long stop = lowest value within the last q periods of the initial low stop.
Here,
- p represents the period for the Highest/Lowest functions.
- x is a user-defined multiplier.
- Default of p, q, x is 10,9,1
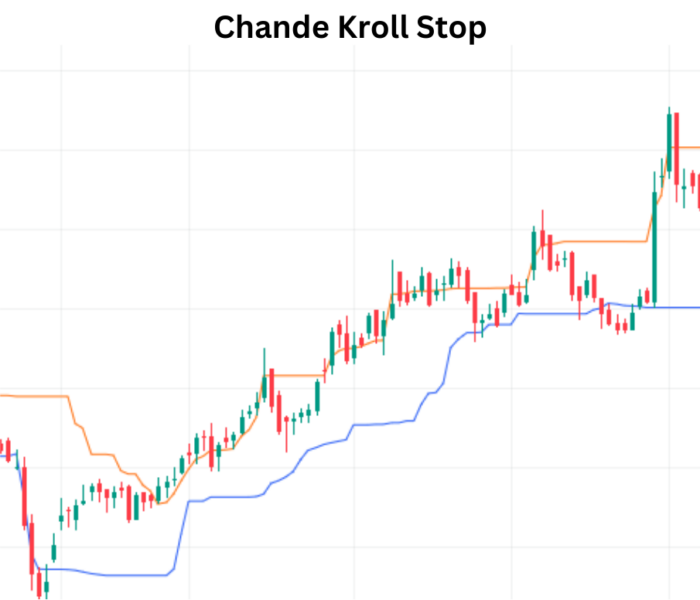
This calculation produces two stop-loss levels, typically a red (or orange) and green (or blue) line. The stop-loss may be placed below the green line for a long position, while it could be placed above the red line for a short position.
So what are the three numbers for the Chande Kroll stop? The ATR’s current period is denoted by the letter P (10 by default), while X represents the ATR multiplier (1 by default). Q is the lookback period for updating the indicator lines; its initial value, 9, means that the indicator will adapt to the highest and lowest values of the short-stop and long-stop lines, respectively, across the previous 9 bars.
Applying the Chande Kroll Stop
Bullish Signals
A buy signal is triggered when the price crosses above both the long and short stop lines. This suggests a potential bullish trend is underway, signaling an opportune time for traders to consider long positions.
Bearish Signals
Conversely, a sell signal emerges when the price falls below both stop lines. This indicates a possible bearish trend, prompting traders to evaluate short positions to capitalize on potential downward movements.
Why Chande Kroll Stop?
- Dynamic Risk Management: By incorporating ATR, the Chande Kroll Stop adapts to the changing volatility of the market, ensuring that stop levels are dynamically adjusted.
- Optimal Stop Placement: The initial high and low stops provide a buffer based on volatility, offering optimal placement to protect capital.
- Clear Trend Signals: The indicator generates clear signals, making it easier for traders to identify potential trend reversals or continuations.
Benefits
Being a dynamic indication that adjusts when the price changes, the Chande Kroll Stop is an effective tool for risk management.
It provides protection against abrupt price swings by accounting for market volatility, which is especially helpful for volatile assets.
All levels of traders can use Chande Kroll’s calculation and application because of its simplicity.
Restrictions
The indicator may be too sensitive to changes in price, which could result in early stop-outs and possibly lost chances.
It might not work as well for assets with low volatility, which would make it inappropriate for some trading strategies or time frames.
It is not advisable to use the Chande Kroll alone. It works best when used in conjunction with other technical indicators and analytical methods.
Conclusion
Effectively managing risk is a cornerstone of successful trading, and the Chande Kroll Stop stands out as a valuable tool in a trader’s arsenal. Providing dynamic and adaptive stop levels based on market volatility, this indicator equips traders with the means to safeguard their investments while navigating the twists and turns of financial markets. By understanding and implementing the signals generated by the Chande Kroll Stop, traders can enhance their risk management strategies and potentially improve overall trading outcomes.
xCalData is an exceptional app available for Android devices that offers unbiased insights into stocks, allowing investors to make informed decisions. With its user-friendly interface and comprehensive features, xCalData provides a valuable resource for anyone interested in the stock market. Download the app from google play.
For Actionable Intelligence, subscribe to xCalData app on Android devices: https://tinyurl.com/downloadxCalData
Popular Posts
-
Stock of Interest . August 23, 2024
#HSCL (NSE) Stock Report | 23 Aug 2024
-
Stock of Interest . August 23, 2024
Add Zerodha trading account to xCalData
-
Stock of Interest . August 23, 2024
What is xCalData , how to use it and how accurate is it?
-
Stock of Interest . August 23, 2024
Jurik Moving Average (JMA): A Profit Trading Insight