Technical Indicator
Posted On: February 7, 2024
Charting Success with Q Stick Indicator
Introduction:
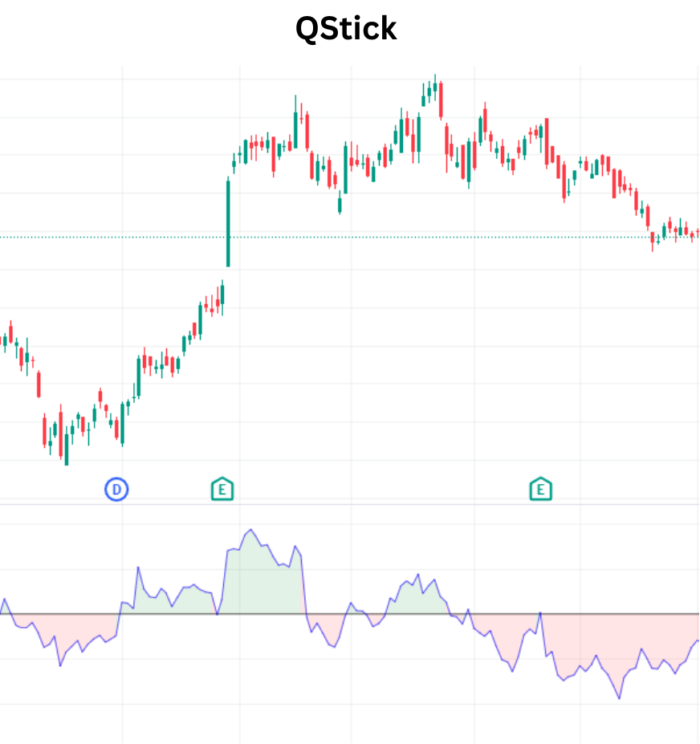
The Q Stick indicator is a valuable technical indicator for traders seeking to quantify and identify trends within candlestick charts. This guide explores the Q Stick indicator, shedding light on its calculation, interpretation, and application in making informed trading decisions.
Understanding Q Stick Calculation:
The Q Stick indicator calculates the moving average of the difference between the Open and Close prices over a specified period. This moving average offers insights into the trend direction and strength, providing traders with a quantitative measure of market sentiment.
Mathematical formula:
Q Stick =SMA (close – open) LENGTH=14
Interpreting Q Stick Signals:
Q Stick signals are instrumental in determining trend shifts and potential buying or selling opportunities. The following conditions guide the interpretation of QStick signals:
- Buy Signal:
- Condition: If the current day QStick value is greater than 0 and the previous value is less than or equal to zero.
- Interpretation: A ‘Buy’ signal is triggered, indicating a potential upward trend in the market.
- Sell Signal:
- Condition: If the current day QStick value is less than 0 and the previous value is greater than or equal to zero.
- Interpretation: A ‘Sell’ signal is generated, suggesting a possible downturn in the market.
- Hold Signal:
- Condition: If none of the above conditions are met.
- Interpretation: The Q Stick remains in a ‘Hold’ position, signifying a period of neutrality or uncertainty.
Incorporating QStick into Trading Strategies:
- Trend Confirmation:
- Utilize QStick signals to confirm prevailing trends identified by other technical indicators for enhanced confidence in trend direction.
- Dynamic Risk Management:
- Integrate QStick insights into risk management strategies, adjusting positions based on identified trend signals to optimize risk-reward ratios.
- Early Trend Reversal Detection:
- Leverage QStick signals to detect early signs of trend reversals, allowing traders to position themselves strategically in anticipation of market shifts.
Conclusion:
The QStick indicator serves as a valuable ally for traders navigating the complexities of candlestick charts. By understanding and interpreting QStick signals, traders can make well-informed decisions, enhance trend analysis, and stay ahead in the dynamic world of financial markets.
xCalData is an exceptional app available for Android devices that offers unbiased insights into stocks, allowing investors to make informed decisions. With its user-friendly interface and comprehensive features, xCalData provides a valuable resource for anyone interested in the stock market. Download the app from google play.
For Actionable Intelligence, subscribe to xCalData app on Android devices: https://tinyurl.com/downloadxCalData
Popular Posts
-
Stock of Interest . August 23, 2024
#HSCL (NSE) Stock Report | 23 Aug 2024
-
Stock of Interest . August 23, 2024
Add Zerodha trading account to xCalData
-
Stock of Interest . August 23, 2024
What is xCalData , how to use it and how accurate is it?
-
Stock of Interest . August 23, 2024
Jurik Moving Average (JMA): A Profit Trading Insight