Technical Indicator
Posted On: January 31, 2024
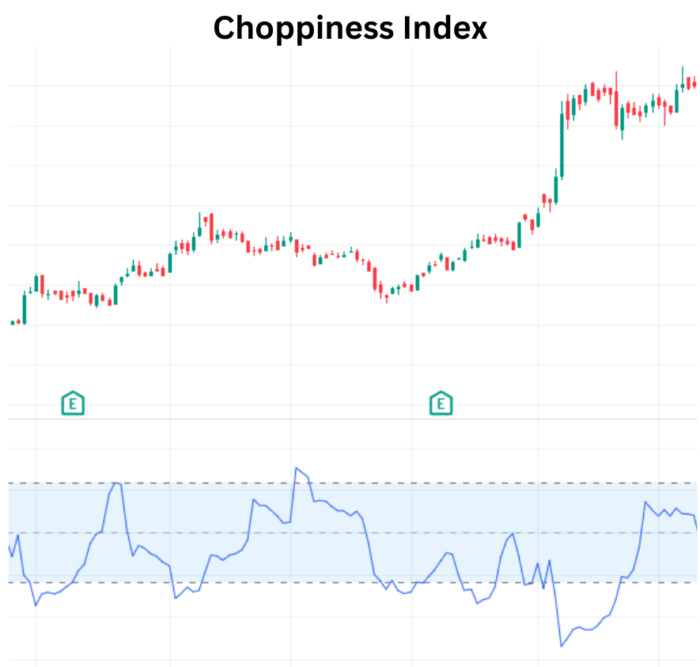
Choppiness Index (CHOP) To Stay On Top Of Market Trends.
Understanding the Choppiness Index
The Choppiness Index (CHOP) stands out among technical indicator as it doesn’t provide directional signals but focuses on discerning whether the market is choppy or trending. Developed by Australian commodity trader E.W. Drevis’s, CHOP helps traders determine the level of choppiness, indicating sideways trading, or directional trending within the market.
The Choppiness Index indicates whether a choppy market exists. A choppy market refers to a market condition where crypto prices swing up and down substantially, either in the short term or long term. In other words, a choppy market is a period of volatility where a trend is generally absent.
Unveiling the Calculation
The Choppiness Index is computed using the following formula:
CHOP = 100 * LOG10( SUM(ATR(1), n) / ( Max High (n) – Min Low(n) ) ) / LOG10(n)
n = User defined period length.
LOG10(n) = base-10 LOG of n
ATR(1) = Average True Range (Period of 1)
SUM(ATR(1), n) = Sum of the Average True Range over past n bars
Max High(n) = The highest high over past n bars
Min Low(n)= The lowest low over past n bars
Interpreting Choppiness
CHOP operates within a range of 0 to 100, serving as a range-bound oscillator. Understanding its values is crucial:
- Closer to 100: Indicates higher choppiness, implying sideways movement.
- Closer to 0: Suggests a stronger trending market with directional movement.
Traders often set threshold values to identify choppiness or trending territories. Commonly, Fibonacci Retracements like 61.8 for the upper threshold and 38.2 for the lower threshold are employed.
Bullish:
If the is Chop value is above over bought and raising, it’s a bullish Signal. And falling bullish reversal.
Bearish:
When the is Chop value is below over sold and falling is bearish, and start bearish reversal signal.
Practical Application
While CHOP provides insights into market conditions, it is essential to use it in conjunction with other tools for a comprehensive analysis. Combining CHOP with trend lines and traditional pattern recognition enhances the ability to identify potential reversals or continuations in ranges or trends.
Traders can use the Choppiness Index in various ways. One of the most common ways is to use it to determine whether to enter or exit a trade. For instance, if the index indicates a choppy market, traders may avoid opening new positions until the market starts trending. On the other hand, if the index indicates a trending market, traders may look for opportunities to enter the market and ride the trend.
When the market is trending, traders can increase their gains by initiating long trading when the price rises or short transactions when the price falls. The price may fluctuate for months in tiny 5–10% steps in a sluggish market. This particular indication was created with the express purpose of filtering out sideways movement noise and indicating when a new trend is about to begin.
Compared to other trend indicators, the Chop Zone and Choppiness Index indicators are highly distinctive. While choppiness indicators merely gauge if the market is rising or moving sideways, trend indicators can predict whether prices will rise or fall. Professional traders frequently utilize them to avoid risk and validate their bias in trading.
Conclusion
In the realm of technical analysis, the Choppiness Index emerges as a unique metric, offering a perspective on market conditions that diverges from traditional directional indicators. Traders benefit from its ability to distinguish between choppy and trending phases, laying the groundwork for informed decision-making. As with any indicator, leveraging CHOP alongside complementary tools enhances its effectiveness in navigating the complexities of financial markets.
xCalData is an exceptional app available for Android devices that offers unbiased insights into stocks, allowing investors to make informed decisions. With its user-friendly interface and comprehensive features, xCalData provides a valuable resource for anyone interested in the stock market. Download the app from google play.
For Actionable Intelligence, subscribe to xCalData app on Android devices: https://tinyurl.com/downloadxCalData
Popular Posts
-
Stock of Interest . August 23, 2024
#HSCL (NSE) Stock Report | 23 Aug 2024
-
Stock of Interest . August 23, 2024
Add Zerodha trading account to xCalData
-
Stock of Interest . August 23, 2024
What is xCalData , how to use it and how accurate is it?
-
Stock of Interest . August 23, 2024
Jurik Moving Average (JMA): A Profit Trading Insight