Technical Indicator
Posted On: January 31, 2024
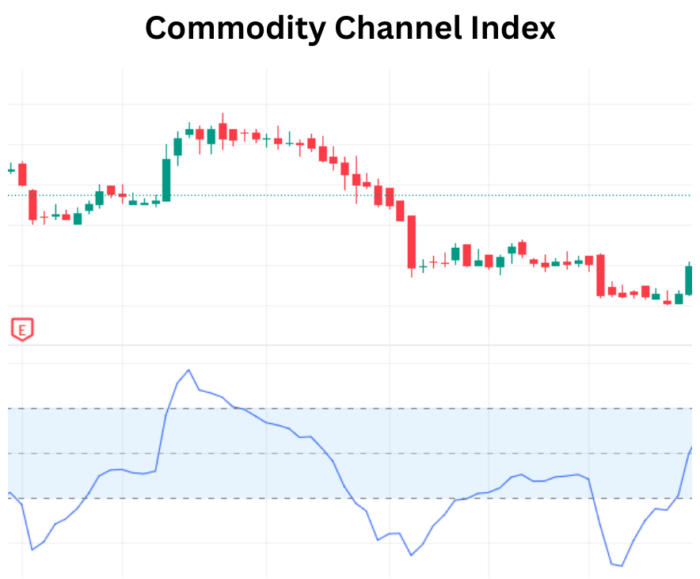
Commodity Channel Index (CCI) Mastery: An All-Inclusive Guide for Traders
Overview:
Traders worldwide harness the power of the Commodity Channel Index (CCI), a robust technical indicator developed by Donald Lambert in the 1980s. This CCI Technical Indicator is Momentum based Indicator, CCI is instrumental in identifying trend reversals, overbought or oversold conditions, and gauging price strength. In this comprehensive exploration, we’ll navigate the intricacies of CCI, covering its calculation, interpretation, and practical application in real-world trading strategies.
Understanding Commodity Channel Index:
The Commodity Channel Index serves as a momentum oscillator, comparing the current price level to the average price over a specified period. The calculation involves finding the difference between the typical price and a simple moving average, normalized by the mean absolute deviation. This formula yields a versatile indicator adaptable to diverse financial products and timeframes.
Important Elements of CCI:
To effectively employ CCI, traders must grasp its essential elements. The default 14-period calculation can be adjusted to align with individual preferences and market conditions. Focus on the +100 and -100 levels aids in identifying potential overbought and oversold situations. Readings below -100 suggest possible oversold conditions, while values above +100 indicate potential overbought scenarios, signaling a potential reversal.
Interpreting CCI Signals:
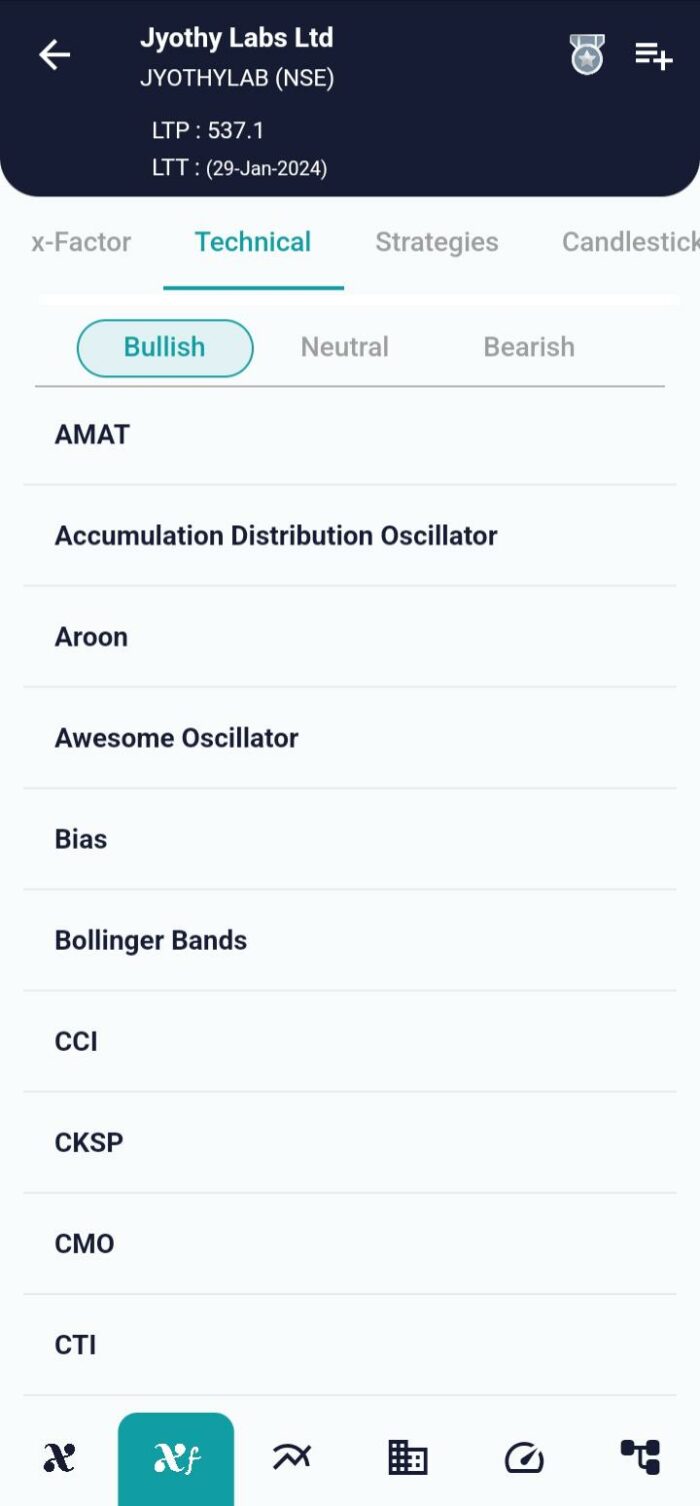
Bullish:
A shift from negative or near-zero CCI readings to above 100 may signal the commencement of an uptrend. Traders can anticipate a pullback in price followed by a rally in both price and CCI, indicating a favorable buying opportunity.
Bearish:
Conversely, a move from positive or near-zero readings to below -100 could signify the onset of a downtrend. This serves as a signal to exit long positions or start exploring shorting opportunities.
Identification of patterns and trends is crucial for interpreting CCI signals. Divergence between CCI and price changes is often considered a potential indicator of a trend reversal. Additionally, CCI crossovers with the zero line can signify changes in trend direction. Traders must leverage CCI in tandem with other technical indicators and tools to confirm signals and enhance analysis precision.
Incorporating CCI into Trading Strategies:
CCI finds application in a myriad of trading strategies. One popular method involves merging CCI with trendlines to pinpoint potential breakouts or breakdowns. Another strategy integrates CCI with other oscillators to corroborate signals. Traders should prioritize risk management practices and stay vigilant for potential false signals when integrating CCI into their trading plans.
In the dynamic landscape of trading strategies, the combination of Commodity Channel Index (CCI) and Relative Strength Index (RSI) brings forth a comprehensive approach. By intertwining the insights from CCI and RSI, this strategy aims to navigate trends and capitalize on potential market opportunities. While offering promising accuracy, it’s crucial for traders to be mindful of inherent risks and approach this strategy with calculated decision-making. This blog post seeks to unveil the intricacies of the CCI – RSI Strategy, exploring the indicators, datasets, parameters, and the conditions triggering buy and sell signals by using xCaldata App.
Conclusion:
In conclusion, mastering the Commodity Channel Index empowers traders to navigate the intricacies of financial markets. Understanding its calculation, adeptly interpreting signals, and integrating it into robust trading strategies allows traders to harness CCI’s power for making informed decisions in the dynamic world of finance. Continuous refinement and adaptation of strategies based on changing market conditions are imperative for sustained success with this versatile technical indicator.
xCalData is an exceptional app available for Android devices that offers unbiased insights into stocks, allowing investors to make informed decisions. With its user-friendly interface and comprehensive features, xCalData provides a valuable resource for anyone interested in the stock market. Download the app from google play.
For Actionable Intelligence, subscribe to xCalData app on Android devices: https://tinyurl.com/downloadxCalData
Popular Posts
-
Stock of Interest . August 23, 2024
#HSCL (NSE) Stock Report | 23 Aug 2024
-
Stock of Interest . August 23, 2024
Add Zerodha trading account to xCalData
-
Stock of Interest . August 23, 2024
What is xCalData , how to use it and how accurate is it?
-
Stock of Interest . August 23, 2024
Jurik Moving Average (JMA): A Profit Trading Insight