Technical Indicator
Posted On: February 7, 2024
Convert Trading Success with Parabolic SAR Indicator
Introduction:
In the dynamic world of trading, effectively identifying trends and potential reversals is crucial for making informed decisions. One technical indicator that aids traders in this endeavor is the Parabolic SAR (Stop and Reverse) indicator. Developed by J. Wells Wilder, this indicator employs a unique trailing stop and reverse method to signal entry and exit points. In this comprehensive guide, we delve into the workings of the Parabolic SAR, its interpretation, and strategies for incorporating it into your trading toolkit.
Understanding the Parabolic SAR Indicator:
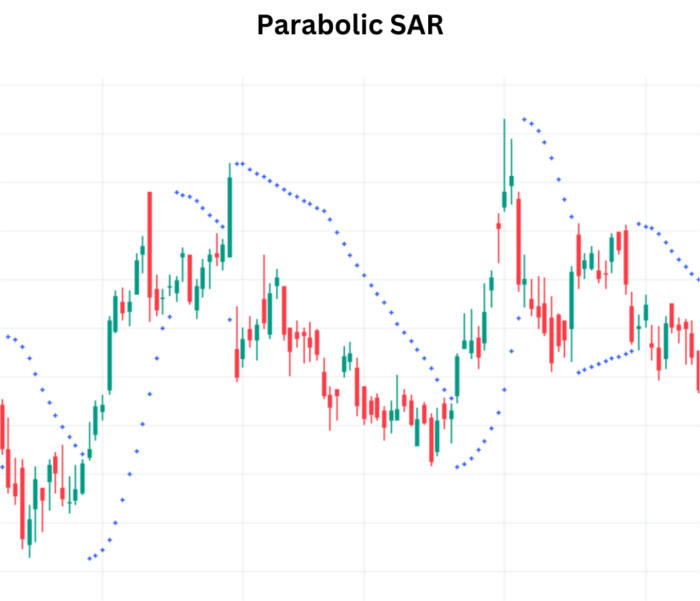
The Parabolic SAR is renowned for its ability to pinpoint trend directions and reversal points. Visualized as a series of dots either above or below an asset’s price, the indicator dynamically adjusts based on price movement. If the dots are below the price, it indicates an upward trend; if above, it signifies a downward trend.
Formula for the Parabolic SAR:
The Parabolic SAR employs two formulas based on whether the trend is rising or falling. The Rising PSAR (RPSAR) and Falling PSAR (FPSAR) are calculated using acceleration factors and extreme points within a given trend.
RPSAR=Prior PSAR+[Prior AF×(Prior EP−Prior PSAR)]
FPSAR=Prior PSAR−[Prior AF×(Prior PSAR−Prior EP)]
Key Components:
- Acceleration Factor (AF): Starts at 0.02 and increases by 0.02, up to a maximum of 0.2, with each new extreme point in the trend.
- Extreme Point (EP): The lowest low in a falling trend or the highest high in a rising trend.
Interpreting Parabolic SAR Signals:
- Zero-line Crossover Signals:
- Buy Signal: When the PSAR crosses above the price, signaling a potential reversal to an upward trend.
- Sell Signal: When the PSAR crosses below the price, indicating a possible shift to a downward trend.
- Hold: When there is no crossover, and the current trend persists.
- Setting Trailing Stop Loss:
- Long Trade: If both the price and PSAR are rising, consider using the PSAR as a trailing stop. Exit the long trade if the price drops below the PSAR.
- Short Trade: If both the price and PSAR are falling, the PSAR can serve as a trailing stop for short trades. Exit the short trade if the price rises above the PSAR.
Incorporating Parabolic SAR into Strategies:
- Trend Confirmation: Use PSAR crossovers to confirm existing trends and make strategic decisions aligned with the prevailing market direction.
- Exit Strategies: Leverage the PSAR as a dynamic tool for setting trailing stop loss orders, aiding in disciplined exits from trades.
Conclusion:
The Parabolic SAR indicator empowers traders to navigate trends and reversals with precision. By understanding its calculations, interpreting signals, and incorporating it into robust trading strategies, traders can enhance their ability to make timely and informed decisions. As with any tool, thorough testing and practice are essential to mastering the Parabolic SAR and unlocking its full potential in the dynamic landscape of financial markets.
xCalData is an exceptional app available for Android devices that offers unbiased insights into stocks, allowing investors to make informed decisions. With its user-friendly interface and comprehensive features, xCalData provides a valuable resource for anyone interested in the stock market. Download the app from google play.
For Actionable Intelligence, subscribe to xCalData app on Android devices: https://tinyurl.com/downloadxCalData
Popular Posts
-
Stock of Interest . August 23, 2024
#HSCL (NSE) Stock Report | 23 Aug 2024
-
Stock of Interest . August 23, 2024
Add Zerodha trading account to xCalData
-
Stock of Interest . August 23, 2024
What is xCalData , how to use it and how accurate is it?
-
Stock of Interest . August 23, 2024
Jurik Moving Average (JMA): A Profit Trading Insight