Technical Indicator
Posted On: January 29, 2024
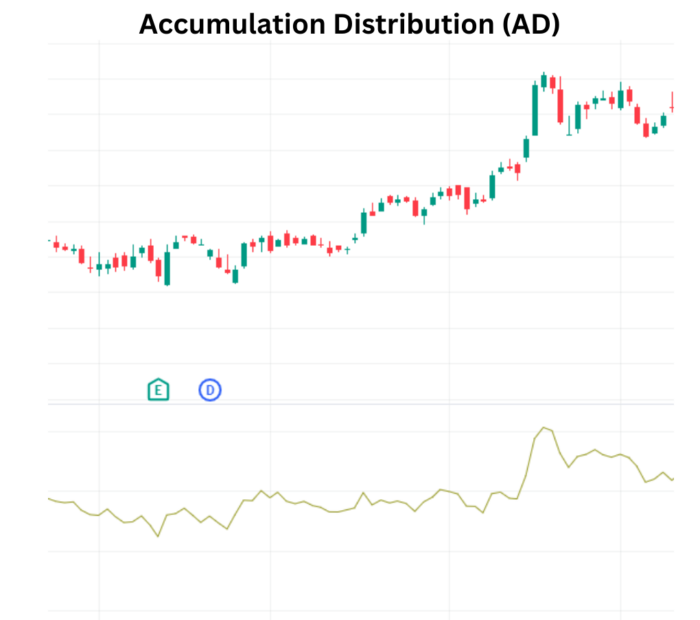
Deciphering Market Trends with Accumulation/Distribution Indicator
In the intricate world of financial markets, traders rely on a myriad of technical indicators to gain insights into the dynamics of stocks. One such powerful tool is the Accumulation/Distribution technical indicator (A/D), a cumulative indicator that utilizes both volume and price to evaluate whether a stock is being accumulated or distributed. In this comprehensive blog post, we will delve into the mathematical formula behind the A/D, its interpretation, and its real-world applications using xCaldata App.
Introduction:
The Accumulation/Distribution Indicator (A/D) stands out as a crucial tool for traders, offering a unique perspective on market trends. Unlike traditional indicators, the A/D doesn’t solely focus on price movements; instead, it incorporates volume, providing a comprehensive assessment of whether a stock is in an accumulation or distribution phase. This indicator helps traders identify divergences between stock price and volume flow, shedding light on the strength of a trend.
Mathematical Formula:
The A/D indicator involves a series of calculations, cumulatively assessing the interplay between price and volume.
- Current A/D: current ad=(2×Close−High+LowHigh−Low)×Volume
- A/D Accumulation: ad=last_ad+current_adad=last_ad+current_ad
- Fast A/D: fast ad=EMA(ad, fast)fast ad=EMA(ad, fast)
- Slow A/D: slow ad=EMA(ad, slow)slow ad=EMA(ad, slow)
- ADOSC (Accumulation/Distribution Oscillator): ADOSC=fast ad−slow ad
Interpretation:
Understanding how to interpret the Accumulation/Distribution technical indicator is crucial for traders looking to leverage its potential.
- If the current day A/D value is greater than the past five days’ average value, the trend is considered an uptrend.
- If the current day A/D value is less than the past five days’ average value, the trend is identified as a downtrend. Otherwise, it is considered neutral.
- A continuous increase in the ADOSC value over three days indicates a bullish trend.
- Conversely, a continuous decrease in the ADOSC value over three days signals a bearish trend.
Real-World Application:
Consider a scenario where a stock exhibits a consistent uptrend in its A/D values, indicating a strong accumulation phase. Traders observing this might interpret it as a bullish signal, suggesting sustained upward momentum. Conversely, if the A/D values consistently decrease, it could be indicative of a distribution phase, prompting traders to consider potential bearish movements.
Conclusion: Navigating Trends with Insight
The Accumulation/Distribution Indicator offers a unique lens through which traders can assess market trends. By incorporating both price and volume into its calculations, the A/D indicator provides nuanced insights into the dynamics of stock accumulation and distribution. As with any technical indicator, traders should use the A/D in conjunction with other tools and conduct thorough analyses to make well-informed decisions.
In conclusion, the Accumulation/Distribution Indicator stands as a valuable asset in a trader’s toolkit. Its ability to identify trends based on both price and volume makes it a powerful tool for navigating the complexities of financial markets. As traders leverage the insights from the A/D indicator, they gain a deeper understanding of market trends, enhancing their decision-making capabilities.
xCalData is an exceptional app available for Android devices that offers unbiased insights into stocks, allowing investors to make informed decisions. With its user-friendly interface and comprehensive features, xCalData provides a valuable resource for anyone interested in the stock market. Download the app from google play.
For Actionable Intelligence, subscribe to xCalData app on Android devices: https://tinyurl.com/downloadxCalData
Popular Posts
-
Stock of Interest . August 23, 2024
#HSCL (NSE) Stock Report | 23 Aug 2024
-
Stock of Interest . August 23, 2024
Add Zerodha trading account to xCalData
-
Stock of Interest . August 23, 2024
What is xCalData , how to use it and how accurate is it?
-
Stock of Interest . August 23, 2024
Jurik Moving Average (JMA): A Profit Trading Insight