Technical Indicator
Posted On: January 29, 2024
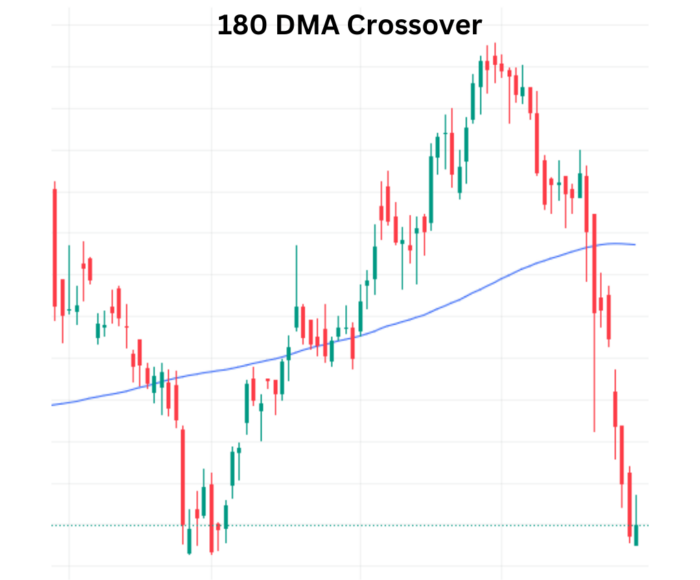
Deciphering Market Trends with Precision: The 180 DMA Crossover
In the dynamic realm of financial markets, traders are on a perpetual quest for tools that provide insights into market dynamics. One such powerful technical indicator is the 180 DMA Crossover (180-day Moving Average), offering valuable signals for potential bullish or bearish movements. In this comprehensive blog post, we delve into the intricacies of the 180 DMA Crossover, unraveling its significance, calculations, and how traders can leverage its insights within the xCalData app.
Understanding the 180 DMA Crossover
Definition:
The 180 DMA Crossover is centered around the interplay between the current price of an asset and its 180-day Moving Average. Acting as a trend-following indicator, the 180 DMA smoothens out price data over a 180-day period, providing a more comprehensive view of the prevailing trend. The fundamental principle is clear-cut: when the current price is above the 180 DMA, it signals a bullish trend; conversely, when it’s below, it indicates a bearish trend.
Calculations:
The 180 DMA is computed by summing up the closing prices of the last 180 days and dividing the result by 180. This dynamic moving average adjusts as new daily data is incorporated, and the oldest day is excluded. The crossover takes place when the current price intersects either above or below this 180 DMA line.
Mathematical Calculation:
180DMA=(Sum of Closing Prices of Last 180 Days)/180
Interpreting the 180 DMA Crossover Technical Indicator
Bullish Signal:
A bullish signal is generated when the current price of an asset moves above the 180 DMA. This suggests that recent price movements are stronger than the average of the past 180 days, indicating potential upward momentum. Traders often interpret this as a buying opportunity, anticipating further price appreciation.
Bearish Signal:
Conversely, a bearish signal emerges when the current price falls below the 180 DMA. This implies that recent price movements are weaker than the average of the past 180 days, hinting at potential downward pressure. Traders may perceive this as a signal to consider selling positions or even initiating short positions.
Significance of the 180 DMA Crossover Technical Indicator
- Extended Trend Analysis:
- The 180 DMA provides an extended perspective on trends, spanning a more prolonged timeframe compared to shorter-term moving averages. This aids traders in comprehending overarching market sentiment.
- Major Trend Confirmation:
- As a major trend confirmation tool, the 180 DMA Crossover helps traders validate whether the current price movement aligns with the longer-term trend indicated by the 180 DMA.
- Strategic Positioning:
- Traders can strategically position themselves based on the 180 DMA Crossover signals, aligning their trades with the prevailing trend and potentially avoiding counter-trend movements.
Real-World Application
In a hypothetical scenario, consider a stock consistently maintaining a price above the 180 DMA. Traders observing this alignment might interpret it as a bullish signal, indicating sustained upward momentum over the long term. Conversely, if the stock’s price consistently falls below the 180 DMA, it could be seen as a bearish signal, suggesting a potential long-term downtrend.
Conclusion: Navigating Trends with Foresight
In the dynamic world of financial markets, foresight is a valuable asset, and the 180 DMA Crossover technical indicator embodies this principle. By distilling complex price movements into clear signals based on the interaction with a 180-day Moving Average, traders gain a powerful tool for trend identification on an extended horizon. As traders leverage the insights from the 180 DMA Crossover, it becomes imperative to complement this indicator with a holistic analysis, considering additional indicators and market dynamics.
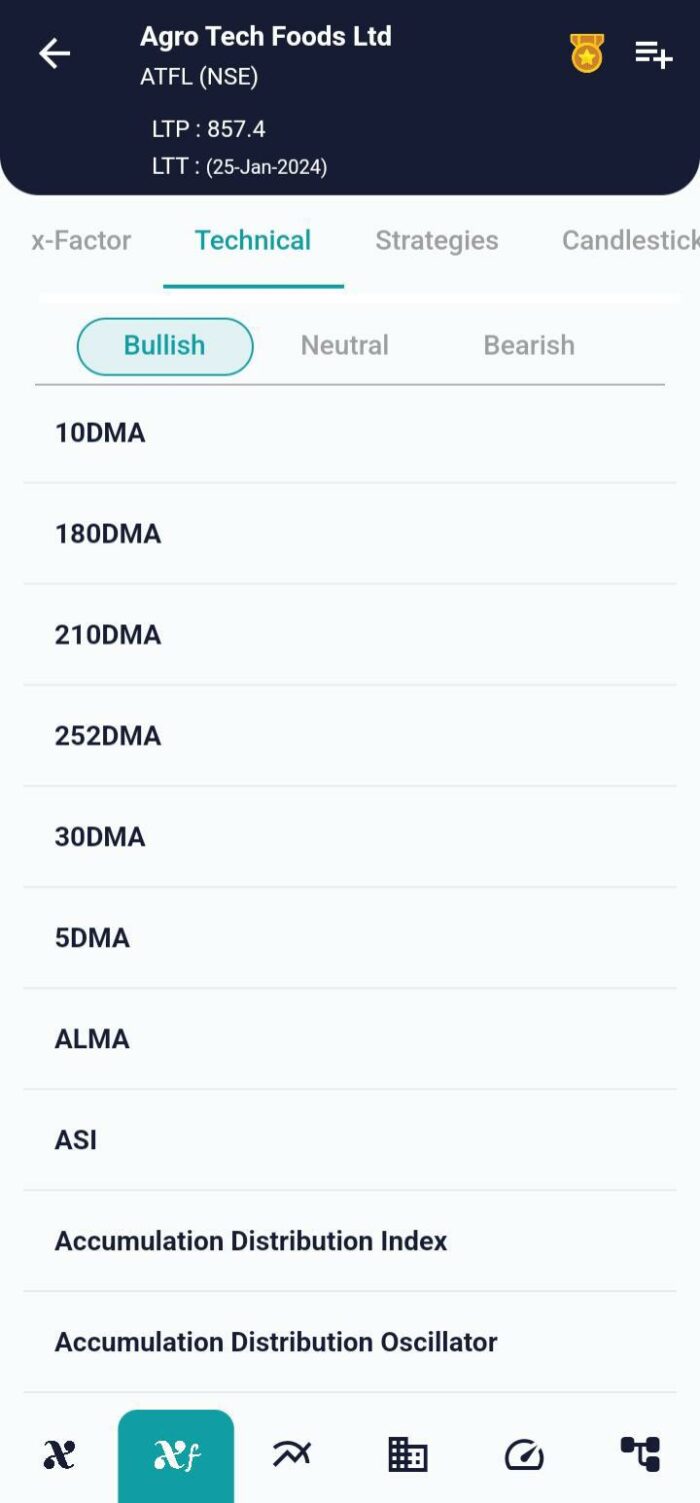
The xCalData app, available for Android devices, offers a robust platform for unbiased insights into stocks, empowering investors to make informed decisions. Download the app from Google Play to access actionable intelligence and enhance your decision-making with the 180 DMA Crossover: Download xCalData.
For Actionable Intelligence, subscribe to xCalData app on Android devices: https://tinyurl.com/downloadxCalData
For traders seeking a broader view and extended trend analysis, the 180 DMA Crossover becomes an indispensable ally in navigating ever-changing trends and making well-informed decisions in the dynamic world of finance.
Popular Posts
-
Stock of Interest . August 23, 2024
#HSCL (NSE) Stock Report | 23 Aug 2024
-
Stock of Interest . August 23, 2024
Add Zerodha trading account to xCalData
-
Stock of Interest . August 23, 2024
What is xCalData , how to use it and how accurate is it?
-
Stock of Interest . August 23, 2024
Jurik Moving Average (JMA): A Profit Trading Insight