Knowledge Base
Posted On: January 29, 2024
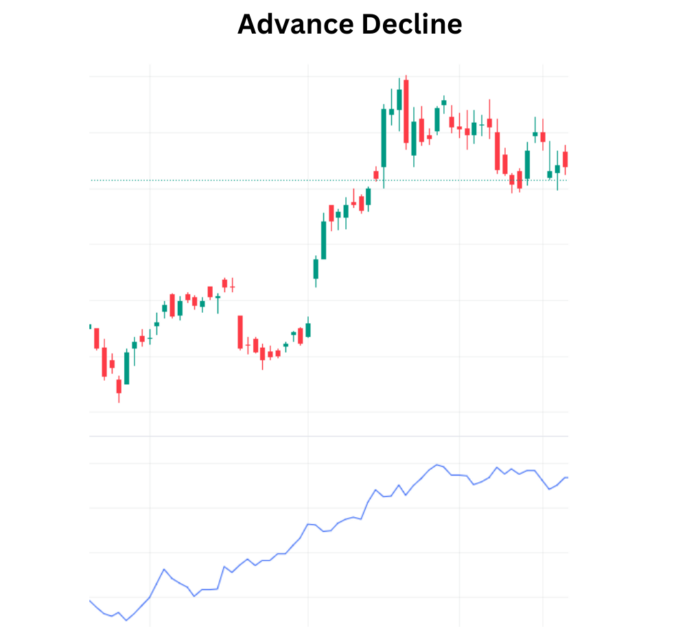
Deciphering Market Volatility with Advance and Decline Indicator
In the ever-changing landscape of financial markets, traders often seek tools that provide insights into the volatility of stocks. One such straightforward yet powerful indicator is the Advance and Decline (Adv Dec) technical indicator . This market indicator is utilized to gauge whether a stock is exhibiting volatility or not, helping traders make informed decisions. In this blog post, we’ll explore the simplicity and effectiveness of the Advance and Decline indicator, its interpretation, and how traders can use it to identify potential buy or sell signals.
Introduction:
The Advance and Decline indicator is a market tool designed to assess the volatility of a stock. Its methodology is refreshingly simple – it calculates the difference between close prices. By focusing on this price differential, traders can gain valuable insights into the stock’s price movements, aiding in the identification of potential market trends.
Mathematical Formula:
The calculation of the Advance and Decline (Adv Dec) technical indicator is a straightforward process:
Adv Dec= (close.diff()>0)−(close.diff()<0)
The indicator is determined by finding the difference between consecutive close prices. If the difference is greater than zero, it contributes to the “Advance” component; otherwise, it contributes to the “Decline” component.
Interpretation for Advance and Decline:
Understanding how to interpret the Advance and Decline indicator is essential for traders looking to leverage its potential signals.
- Bullish Signal: If the AdvDec value is greater than zero, it indicates a bullish signal, suggesting a potential buying opportunity. This implies that the stock has experienced an advancement in prices.
- Bearish Signal: Conversely, when the AdvDec value is less than zero, it signals a bearish trend. Traders may interpret this as a sell signal, indicating a decline in prices.
Real-World Application:
Consider a scenario where the Adv Dec value is consistently positive over a period. Traders might interpret this as a bullish signal, suggesting that the stock is experiencing a series of advances, potentially indicating an uptrend. On the contrary, if the Adv Dec values consistently show negativity, it could be a bearish signal, hinting at a potential downtrend.
Conclusion: Navigating Volatility with Precision
The Advance and Decline indicator, with its simplicity and effectiveness, serves as a valuable tool for traders navigating the complexities of market volatility. By focusing on the difference between close prices, it distills market movements into clear signals, aiding traders in making informed decisions.
In conclusion, the Advance and Decline indicator stands as a testament to the power of simplicity in market analysis. Traders can use this indicator as part of their toolkit, combining it with other tools and analyses for a comprehensive understanding of market conditions. As they leverage the insights from the Adv Dec indicator, traders gain a sharper perspective on market volatility, enhancing their ability to make well-informed decisions in the dynamic world of finance.
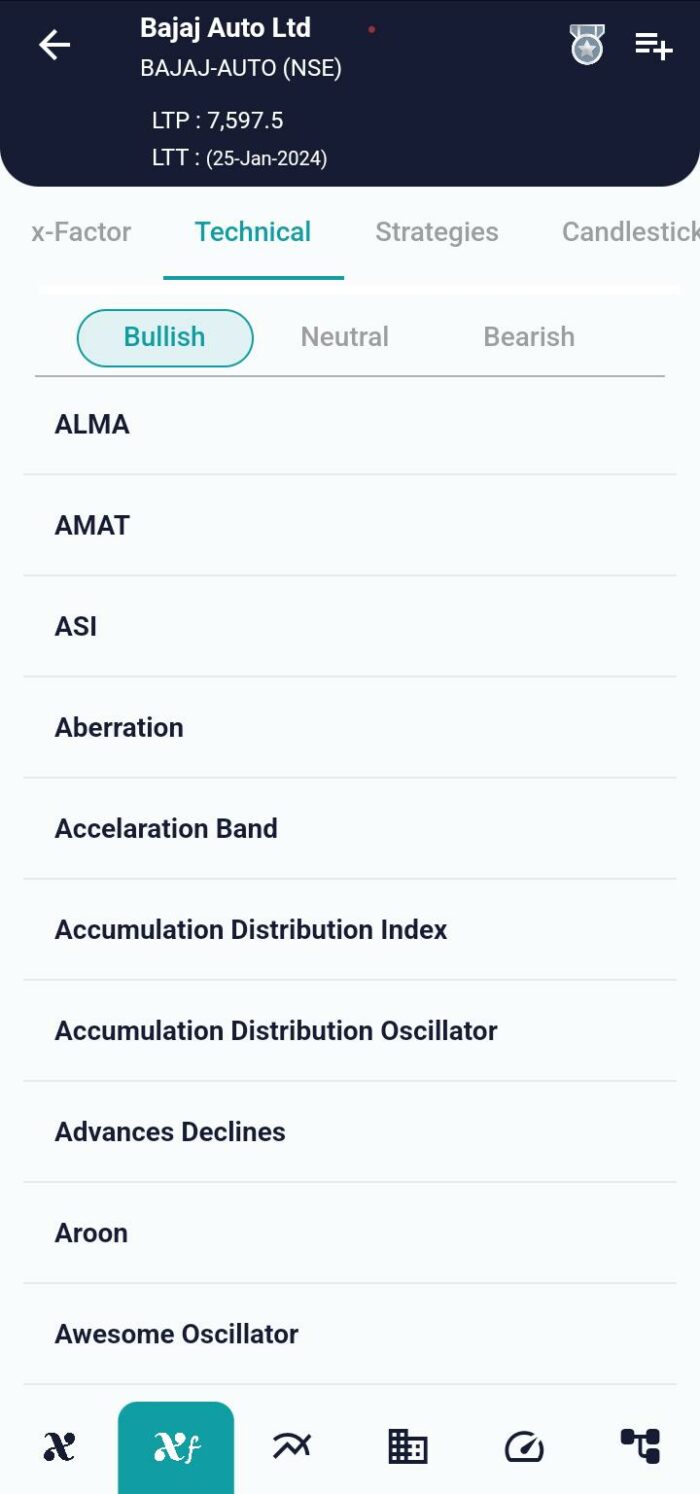
xCalData is an exceptional app available for Android devices that offers unbiased insights into stocks, allowing investors to make informed decisions. With its user-friendly interface and comprehensive features, xCalData provides a valuable resource for anyone interested in the stock market. Download the app from google play.
For Actionable Intelligence, subscribe to xCalData app on Android devices: https://tinyurl.com/downloadxCalData
Popular Posts
-
Stock of Interest . August 23, 2024
#HSCL (NSE) Stock Report | 23 Aug 2024
-
Stock of Interest . August 23, 2024
Add Zerodha trading account to xCalData
-
Stock of Interest . August 23, 2024
What is xCalData , how to use it and how accurate is it?
-
Stock of Interest . August 23, 2024
Jurik Moving Average (JMA): A Profit Trading Insight