Technical Indicator
Posted On: January 29, 2024
Deciphering Momentum: The Acceleration Band Unveiled
In the dynamic realm of financial markets, traders are constantly seeking effective tools to navigate through the complexities and make informed decisions. One such impactful technique is the Acceleration Band, introduced by Price Headley in 2002. This method is particularly valuable for identifying periods of high momentum, empowering traders to discern optimal entry and exit points. In this comprehensive blog post, we’ll delve into the intricacies of the Acceleration Band, exploring its mathematical formula, interpretation, and practical applications.
Introduction:
The Acceleration Band is a volatility indicator designed to capture and measure market fluctuations, similar to the Keltner Channel. Volatility technical indicator play a crucial role in helping traders identify potential market trends, making them valuable tools in decision-making.
Mathematical Formula:
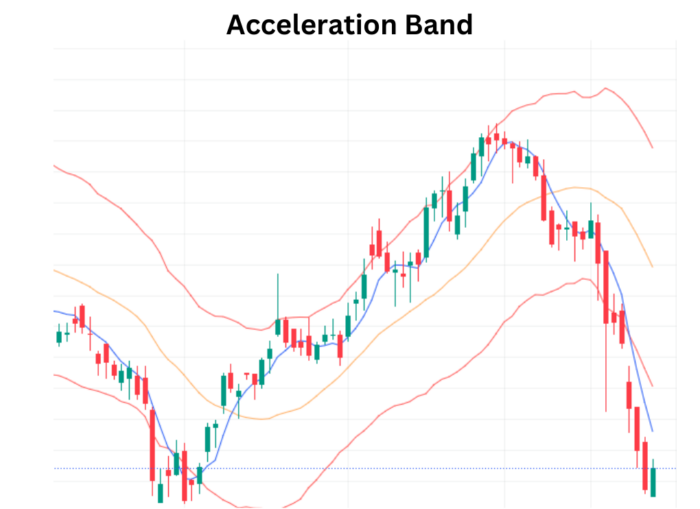
At the core of the Acceleration Band is a set of calculations designed to derive upper and lower bands along with a midline.
- Upper Band: Upper Band = high * (1 + 2 * ((((high – low) / (high + low) / 2) * 1000) * factor)
- Lower Band: Lower Band = low * (1 + 2 * ((((high – low) / (high + low) / 2) * 1000) * factor)
- Midline: Midline = (Upper Band + Lower Band) / 2
- Acceleration Upper Band: Acceleration Upper Band = Moving average of Upper Band with a 20-period
- Acceleration Lower Band: Acceleration Lower Band = Moving average of Lower Band with a 20-period
Interpretation:
Understanding how to interpret the Acceleration Band is pivotal for traders aiming to leverage its potential.
Acceleration Band Trend:
- Bullish: Close Price crosses midline from below
- Bearish: Close price crosses midline from above
Acceleration Band Interpretation:
- Uptrend: Close Price crossed above the upper band and lower band from below.
- Downtrend: Close Price crossed upper band and lower band from above.
Real-World Application:
Let’s consider a practical scenario where a stock exhibits heightened volatility, and traders are keen on identifying periods of robust momentum. Applying the Acceleration Band, traders observe the Close Price crossing above the upper band from below, indicating an uptrend. This signals potential buying opportunities. Conversely, if the Close Price crosses the upper band and lower band from above, it suggests a downtrend, prompting traders to explore potential selling opportunities.
Conclusion: Navigating Momentum with Precision
In the ever-evolving landscape of financial markets, mastering momentum is key to making informed trading decisions. The Acceleration Band, with its calculated upper and lower bands, along with a midline, equips traders with a valuable tool to identify trends and make decisions during periods of high momentum.
As with any technical indicator, it’s crucial for traders to integrate the Acceleration Band into a comprehensive analysis, considering it alongside other indicators and market factors. This approach enhances the accuracy of trading decisions and provides a nuanced understanding of market dynamics.
xCalData is an exceptional app available for Android devices that offers unbiased insights into stocks, allowing investors to make informed decisions. With its user-friendly interface and comprehensive features, xCalData provides a valuable resource for anyone interested in the stock market. Download the app from google play.
For Actionable Intelligence, subscribe to xCalData app on Android devices: https://tinyurl.com/downloadxCalData
Popular Posts
-
Stock of Interest . August 23, 2024
#HSCL (NSE) Stock Report | 23 Aug 2024
-
Stock of Interest . August 23, 2024
Add Zerodha trading account to xCalData
-
Stock of Interest . August 23, 2024
What is xCalData , how to use it and how accurate is it?
-
Stock of Interest . August 23, 2024
Jurik Moving Average (JMA): A Profit Trading Insight