Candlestick Pattern
Posted On: September 21, 2023
Deciphering the Doji Candlestick Pattern in Trading
A Comprehensive Manual for Traders:
In the dynamic world of financial markets, traders and investors often turn to technical analysis to gain insights into market sentiment and potential reversals. Among the numerous tools in the trader’s arsenal, candlestick patterns play a crucial role. The “Doji” candlestick pattern is a fascinating and frequently encountered formation that signifies market indecision. In this blog post, we will explore the concept of the Doji candlestick pattern, uncover its characteristics, and discuss how traders can identify and interpret it effectively.
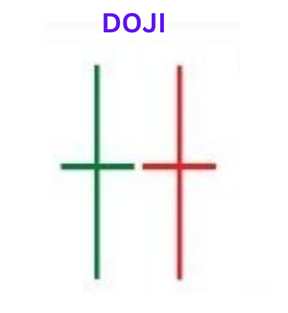
The Doji is a single candlestick pattern known for its distinctive appearance. It is characterized by a candlestick with a small, often non-existent, real body. What makes the Doji unique is that its opening and closing prices are nearly identical, resulting in the appearance of a horizontal line or cross. This pattern reflects a temporary equilibrium between buyers and sellers, representing uncertainty and indecision in the market
Characteristics of Doji:
To recognize the Doji pattern, traders should focus on the following key characteristics:
- Small Real Body: The Doji has a small real body, indicating little price difference between the opening and closing prices.
- Equal or Near-Equal Opening and Closing Prices: The opening and closing prices of the Doji candlestick are remarkably close to each other.
- Long Upper and Lower Shadows: Doji candles often have long upper and lower shadows, indicating that prices moved significantly higher and lower during the trading session.
- Context Matters: The Doji significance depends on its location within the price chart and the preceding price action. It’s essential to consider the context to interpret its meaning accurately.
Interpreting Doji:
The Doji is a versatile candlestick pattern with multiple interpretations, depending on its context:
- Indecision: The Doji suggests market indecision or a temporary standoff between buyers and sellers. It can signal a potential trend reversal or a continuation of the current trend.
- Reversal Signal: When a Doji appears after a strong uptrend or downtrend, it can indicate a potential reversal. For instance, a Doji after a prolonged uptrend might suggest that buyers are losing momentum.
- Continuation Pattern: In some cases, the Doji can act as a continuation pattern, suggesting that the prevailing trend is likely to persist.
Confirmation and Trading Strategies: While the Doji can provide valuable insights, traders often seek confirmation from other technical indicators or patterns before making trading decisions. This can include examining volume, support and resistance levels, and additional candlestick patterns. Trade execution should always be accompanied by proper risk management, including setting stop-loss orders to mitigate potential losses.
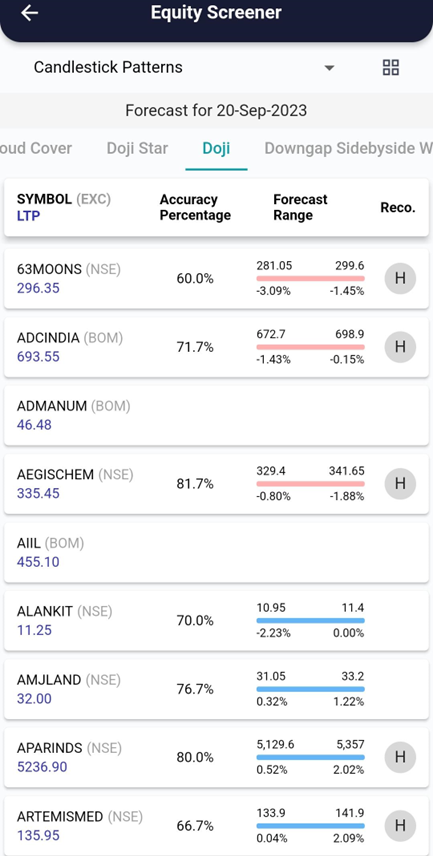
xCalData analyses the candles of individual stocks daily and identifies the stocks forming various patterns. Checkout xCalData app to know all the candle stick patterns formed by the stock of your interest.

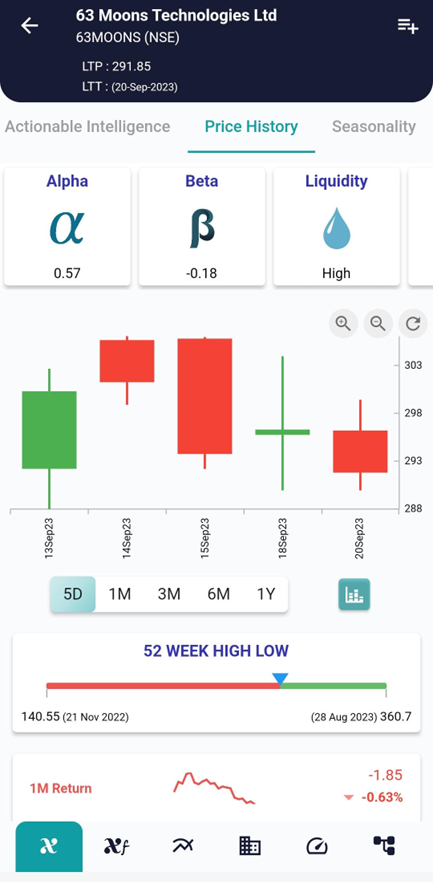
Example, on 18 Sep the stock showed the Shooting Star Candlestick Pattern and on 20 Sep the stock started going down(Bullish to Bearish) as can be seen in the interpretation above.
Conclusion:
The Doji candlestick pattern is a fascinating and versatile tool for traders, offering insights into market indecision and potential trend reversals. However, it should be used in conjunction with other forms of analysis and risk management strategies. Successful trading requires a comprehensive understanding of candlestick patterns and continuous learning. Remember, trading always involves risk, and it is crucial to develop a well-rounded trading strategy, including risk management techniques, to increase your productivity and achieve long-term success in the financial markets, Visit and download xCalData.
Trading always involves risk, and it is crucial to develop a well-rounded trading strategy, including risk management techniques, to increase your productivity and achieve long-term success in the financial markets, Visit and download xCalData.
Where can I see further insights on this stock?
xCalData offers unbiased insights into stocks. Download the app from google play. For Actionable Intelligence, subscribe to xCalData app on Android devices: Download here

Disclaimer: The securities quoted are for illustration only and are not recommendatory.
Popular Posts
-
Stock of Interest . August 23, 2024
#HSCL (NSE) Stock Report | 23 Aug 2024
-
Stock of Interest . August 23, 2024
Add Zerodha trading account to xCalData
-
Stock of Interest . August 23, 2024
What is xCalData , how to use it and how accurate is it?
-
Stock of Interest . August 23, 2024
Jurik Moving Average (JMA): A Profit Trading Insight