Technical Indicator
Posted On: February 6, 2024
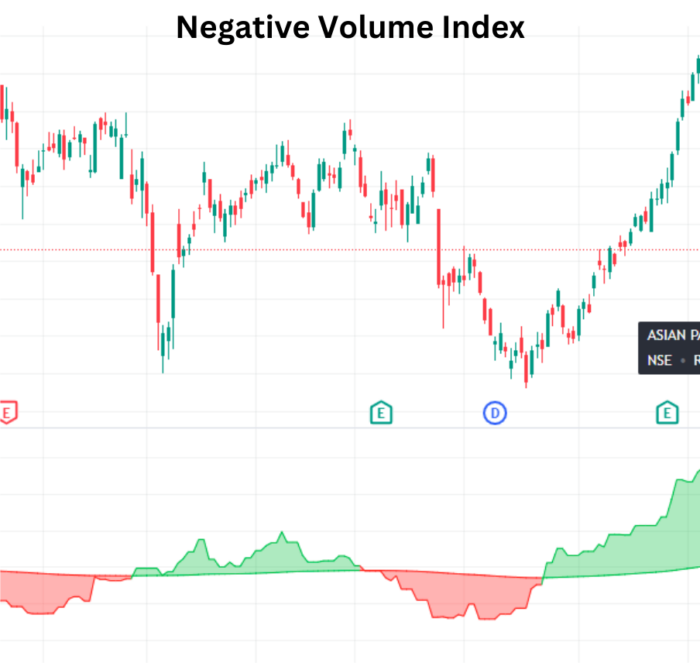
Decoding Market Sentiment with Negative Volume Index (NVI)
Introduction:
In the intricate world of financial markets, deciphering the activities of smart money is a quest pursued by many traders. One technical indicator that aids in this endeavor is the Negative Volume Index (NVI), developed by Paul Dysart in the 1930s. This cumulative indicator focuses on volume dynamics to discern when institutional investors or “smart money” might be actively shaping market movements. This article explores the nuances of NVI and how traders can interpret its signals to gain insights into market sentiment.
Understanding Negative Volume Index (NVI):
Negative Volume Index (NVI) operates on the premise that smart money tends to generate price movements with lower volume compared to the broader market. By cumulatively tracking changes in volume, NVI aims to identify periods when institutional investors are likely influencing price trends.
NVI t= ((Pt−Pt−1)/ Pt−1) ×NVIt−1
where:
NVI t=Negative volume index at time t
Key NVI Signals:
- Bullish View:
- When Negative Volume Index is greater than the NVI Exponential Moving Average (NVI_EMA), it signals a bullish view.
- This scenario suggests that price movements driven by smart money exhibit less reliance on volume, indicating potential upward momentum.
- Bearish View:
- If NVI is less than the NVI_EMA, it indicates a bearish view.
- This condition implies that smart money-driven price movements may be associated with lower volume, signaling a potential downward trend.
- Neutral View:
- In cases where NVI is neither greater nor less than NVI_EMA, the indicator suggests a neutral view.
- This neutral stance may indicate a period where the influence of smart money on price movements is not distinctly evident.
Incorporating NVI in Trading Strategies:
- Confirmation of Smart Money Activity: Negative Volume Index can serve as a confirmation tool to validate whether institutional investors are actively shaping price trends with lower volume.
- Contrarian Signals: Traders can use Negative Volume Index signals as contrarian indicators, considering potential reversals when smart money diverges from the broader market sentiment.
- Combining with Other Indicators: Enhance the robustness of your strategy by integrating NVI signals with complementary technical indicators for a comprehensive market analysis.
Conclusion:
The Negative Volume Index (NVI) stands as a unique tool in the trader’s arsenal, providing insights into the activities of smart money based on volume dynamics. By interpreting NVI signals, traders can gain a better understanding of potential bullish, bearish, or neutral market conditions. As with any indicator, combining NVI with other tools and employing prudent risk management remains essential for successful trading. Explore the capabilities of NVI as you navigate the complexities of market sentiment and strive to stay one step ahead in your trading journey.
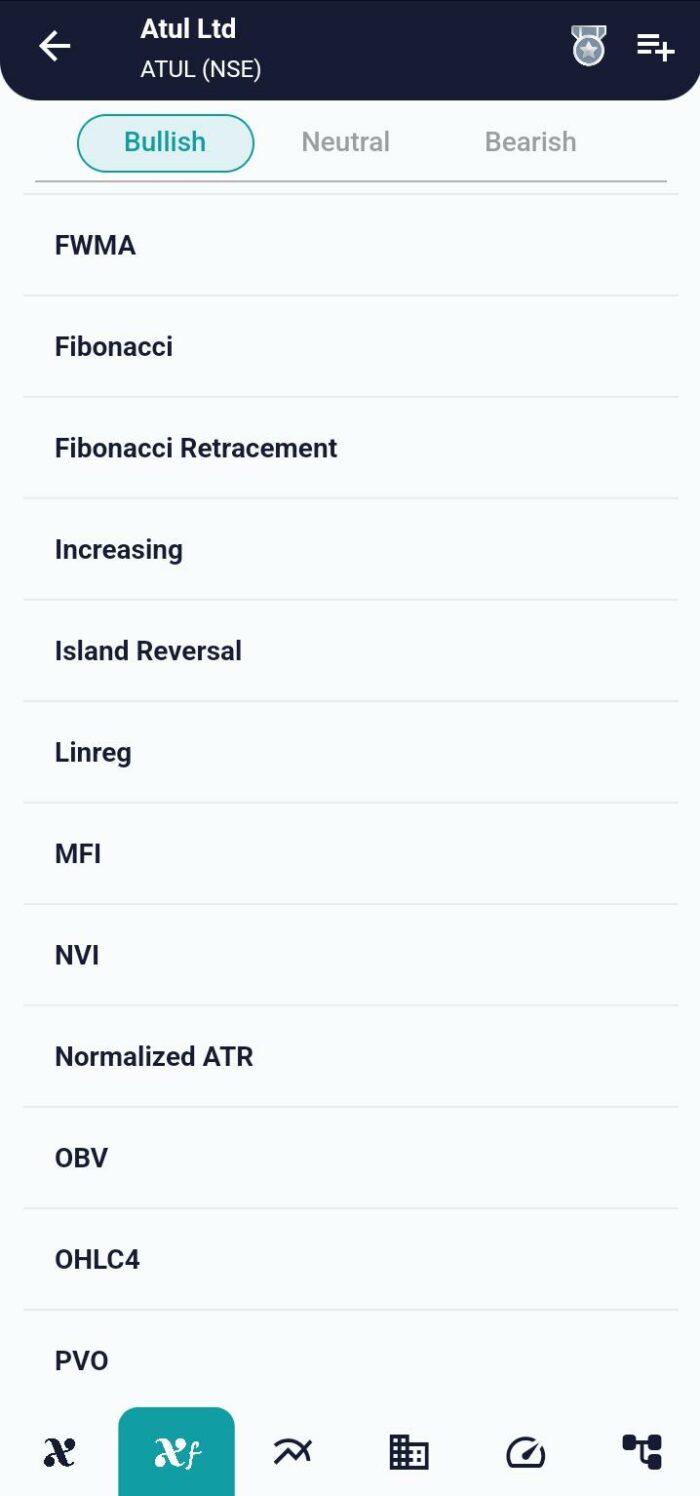
xCalData is an exceptional app available for Android devices that offers unbiased insights into stocks, allowing investors to make informed decisions. With its user-friendly interface and comprehensive features, xCalData provides a valuable resource for anyone interested in the stock market. Download the app from google play.
For Actionable Intelligence, subscribe to xCalData app on Android devices: https://tinyurl.com/downloadxCalData
Popular Posts
-
Stock of Interest . August 23, 2024
#HSCL (NSE) Stock Report | 23 Aug 2024
-
Stock of Interest . August 23, 2024
Add Zerodha trading account to xCalData
-
Stock of Interest . August 23, 2024
What is xCalData , how to use it and how accurate is it?
-
Stock of Interest . August 23, 2024
Jurik Moving Average (JMA): A Profit Trading Insight