Technical Indicator
Posted On: January 30, 2024
Decoding Market Trends: Aroon Indicator Unveiled
In the ever-evolving landscape of financial markets, traders employ a myriad of technical indicators to decipher trends and seize potential trading opportunities. One such powerful tool is the Aroon technical indicator, developed by Tushar Chande in 1995. This indicator is designed to identify trend changes in asset prices and gauge the strength of those trends. In this comprehensive blog post, we will delve into the workings of the Aroon indicator, its key components, calculation methods, and practical applications.
Mathematical Formulas and Components:
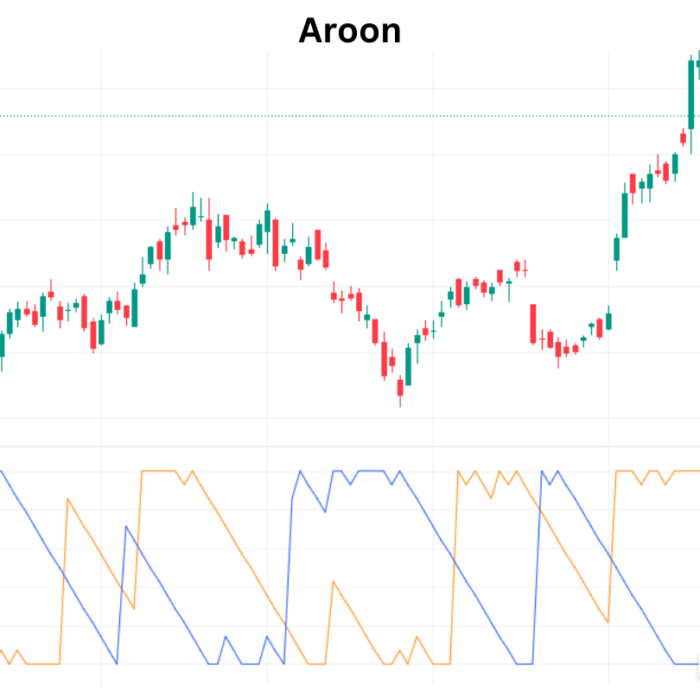
The Aroon indicator comprises two crucial lines – the “Aroon Up” line and the “Aroon Down” line. These lines measure the time between highs and lows over a specified period, typically 25 periods. The formulas for Aroon Up and Aroon Down are as follows:
Aroon Up=((25−Periods Since 25-period High)/25)×100
Aroon Down=((25−Periods Since 25-period Low)/25)×100
These formulas produce values between zero and 100, providing insights into the strength and direction of trends.
Aroon Interpretation:
The Aroon indicator’s interpretation revolves around zero-line crossovers and divergence patterns.
.png)
Zero-line Crossover:
- Bullish Signal: Aroon Up crossing above Aroon Down indicates bullish price behavior, suggesting a potential uptrend.
- Bearish Signal: Aroon Down crossing above Aroon Up signals bearish price behavior, indicating a potential downtrend.
- Neutral Signal: If neither crossover occurs, the market lacks a clear directional bias, and the signal is considered neutral.
Divergence:
- Bullish Divergence: Formed when prices make a lower low, but Aroon Up forms a higher low, signaling potential buying opportunities.
- Bearish Divergence: Formed when prices make a higher high, but Aroon Up forms a lower high, indicating potential selling opportunities.
Calculation Process:
To calculate the Aroon indicator:
- Track the highest and lowest prices over the last 25 periods.
- Note the number of periods since the last high and low.
- Plug these values into the Aroon Up and Aroon Down formulas.
Practical Applications:
- Trend Identification: Aroon helps traders identify and confirm trends. Values close to 100 denote a strong trend, while values near zero suggest a weak trend.
- Entry and Exit Points: Crossovers serve as potential signals for entering or exiting trades. Aroon Up crossing above Aroon Down may signal a new uptrend.
- Consolidation Detection: Both indicators below 50 may indicate a period of consolidation, where new highs or lows are not being created. Traders can anticipate breakouts based on the next Aroon crossover.
Conclusion:
Incorporating the Aroon indicator into a trader’s toolkit empowers them to navigate the dynamic landscape of financial markets with precision. Whether identifying crossovers, analyzing divergences, or confirming trend strength, the Aroon indicator proves to be a versatile ally for informed decision-making. As traders strive to decode market trends, the Aroon indicator stands as a valuable resource in their analytical arsenal.
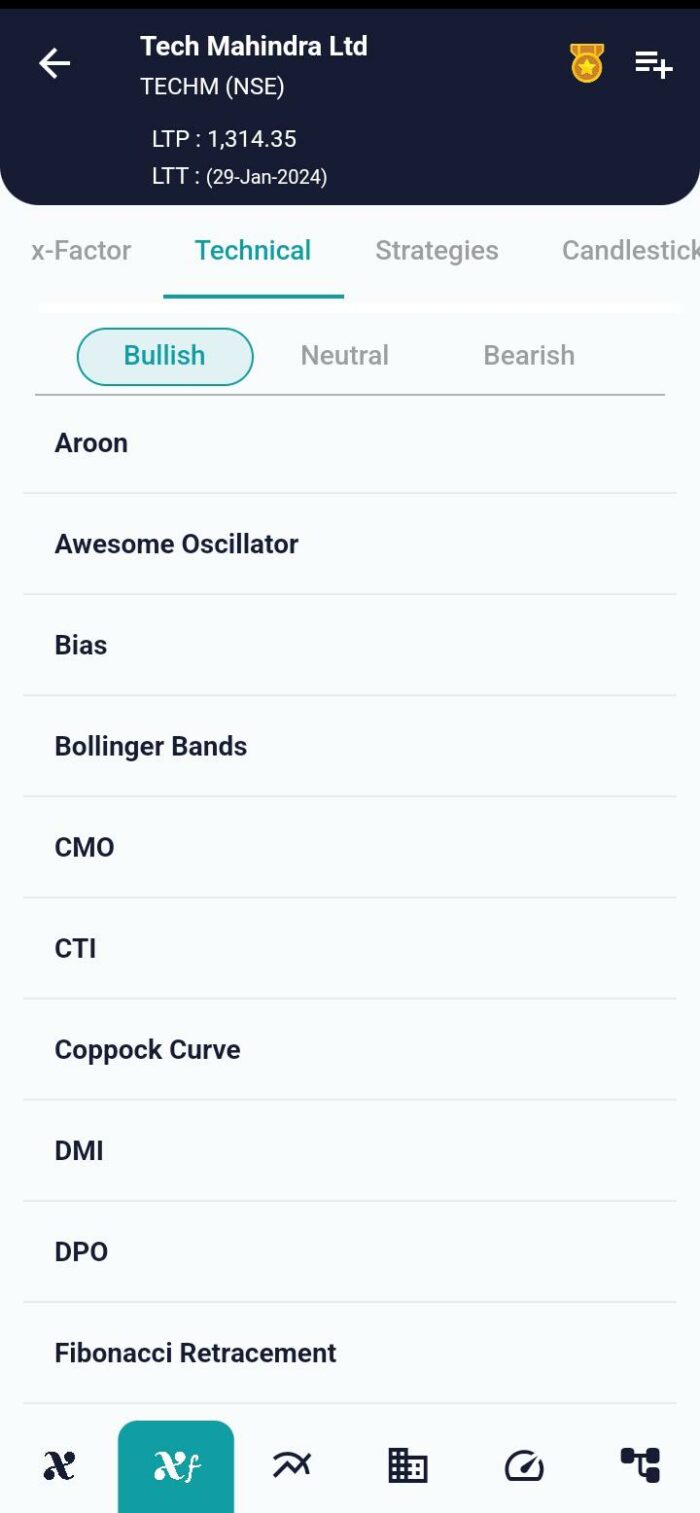
xCalData is an exceptional app available for Android devices that offers unbiased insights into stocks, allowing investors to make informed decisions. With its user-friendly interface and comprehensive features, xCalData provides a valuable resource for anyone interested in the stock market. Download the app from google play.
For Actionable Intelligence, subscribe to xCalData app on Android devices: https://tinyurl.com/downloadxCalData
Popular Posts
-
Stock of Interest . August 23, 2024
#HSCL (NSE) Stock Report | 23 Aug 2024
-
Stock of Interest . August 23, 2024
Add Zerodha trading account to xCalData
-
Stock of Interest . August 23, 2024
What is xCalData , how to use it and how accurate is it?
-
Stock of Interest . August 23, 2024
Jurik Moving Average (JMA): A Profit Trading Insight