Technical Indicator
Posted On: February 6, 2024
Decoding Market Trends with the Linear Regression Indicator
The Linear Regression technical indicator stands as a beacon in the realm of technical analysis, offering traders a statistical perspective on price movements. This powerful tool plots the ending value of a Linear Regression Line over a defined number of bars, providing valuable insights into where the price is expected to be. In this blog, we unravel the intricacies of the Linear Regression Indicator and explore how traders can harness its signals to make informed decisions in the dynamic world of finance.
Unveiling the Linear Regression Indicator
Understanding the Basics
The Linear Regression Indicator utilizes statistical methods to project the future direction of prices based on historical data. By calculating a linear regression line, this indicator offers a visual representation of the expected price movement over a specified period.
Interpreting Linear Regression Signals
Bullish Signals
- Signal: If the linreg value experiences an increase from its previous reading, it generates a Buy signal.
- Implication: This suggests a potential uptrend in the market, providing traders with an opportunity to consider buying.
Bearish Signals
- Signal: When the linreg value decreases from its previous reading, it triggers a Sell signal.
- Implication: This signals a potential downtrend, prompting traders to contemplate selling or adopting a bearish stance.
Crafting Effective Trading Strategies
1. Confirmation with Other Indicators:
- Strengthen the reliability of Linear Regression signals by cross-referencing them with insights from other technical indicators.
2. Setting Realistic Targets:
- Establish clear profit targets and stop-loss levels based on the expected price movements indicated by the Linear Regression line.
3. Adapting to Market Conditions:
- Consider adjusting the lookback period of the Linear Regression Indicator to align with different market conditions and timeframes.
Potential Pitfalls to Navigate
1. False Signals:
- Acknowledge the possibility of false signals and use risk management strategies to mitigate potential losses.
2. Market Context:
- Evaluate Linear Regression signals within the broader context of market conditions to avoid making isolated trading decisions.
In Conclusion
As traders venture into the intricacies of market analysis, the Linear Regression Indicator serves as a valuable ally, offering a statistical compass to navigate price movements. By deciphering its signals and integrating them into a comprehensive trading strategy, market participants can enhance their decision-making prowess and navigate the complex landscape of financial markets. May your trading journey be marked by clarity, precision, and success! Happy trading!
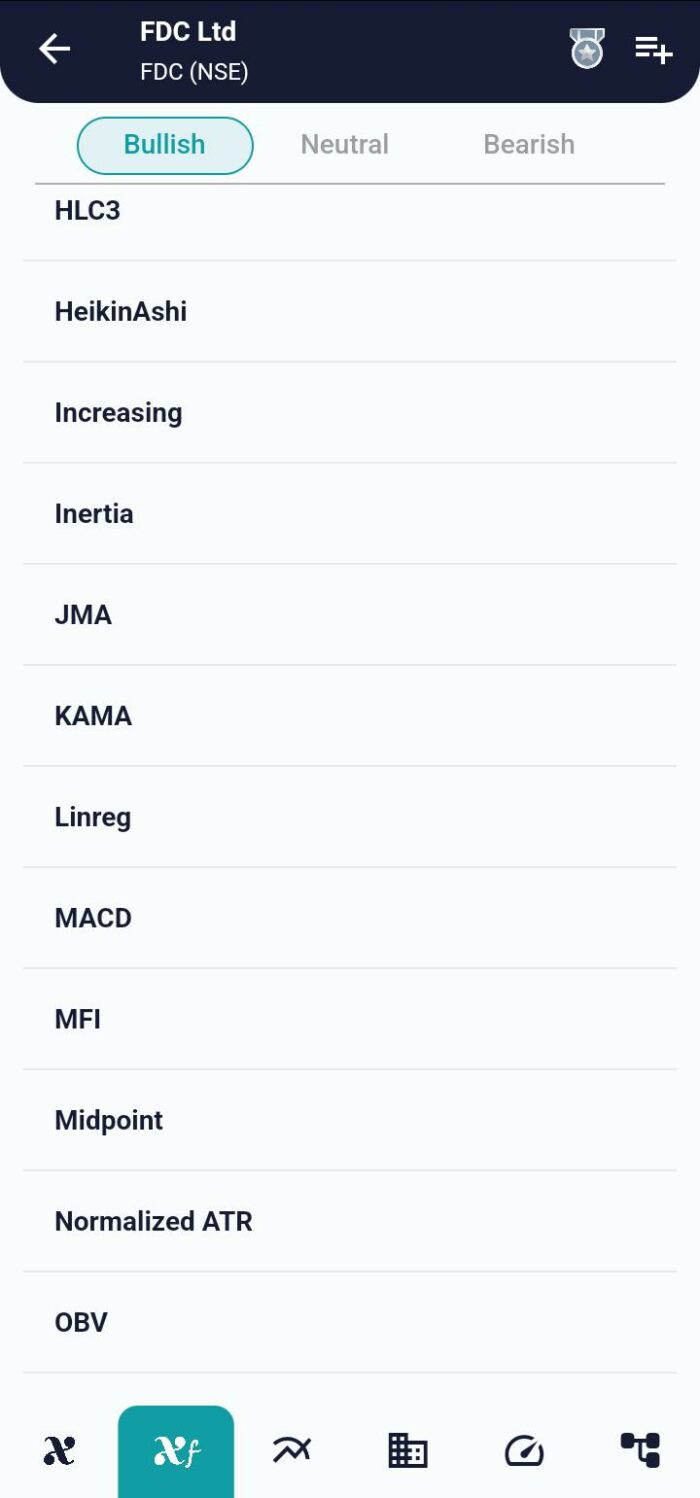
xCalData is an exceptional app available for Android devices that offers unbiased insights into stocks, allowing investors to make informed decisions. With its user-friendly interface and comprehensive features, xCalData provides a valuable resource for anyone interested in the stock market. Download the app from google play.
For Actionable Intelligence, subscribe to xCalData app on Android devices: https://tinyurl.com/downloadxCalData
Popular Posts
-
Stock of Interest . August 23, 2024
#HSCL (NSE) Stock Report | 23 Aug 2024
-
Stock of Interest . August 23, 2024
Add Zerodha trading account to xCalData
-
Stock of Interest . August 23, 2024
What is xCalData , how to use it and how accurate is it?
-
Stock of Interest . August 23, 2024
Jurik Moving Average (JMA): A Profit Trading Insight