Candlestick Pattern
Posted On: October 4, 2023
Decoding the Dark Cloud Cover Candlestick Pattern in Trading
A Comprehensive Manual for Traders:
In the ever-evolving world of financial markets, traders constantly seek reliable tools to help them make informed decisions. Candlestick patterns are a fundamental aspect of technical analysis, offering traders insights into market sentiment. Among these patterns, the “Dark Cloud Cover” candlestick pattern is a compelling indicator of potential trend reversals. In this blog post, we will explore the concept of the Dark Cloud Cover candlestick pattern, unravel its key characteristics, and discuss how traders can effectively identify and interpret it.
The Dark Cloud Cover is a two-candlestick pattern that appears at the end of an uptrend. It serves as a warning sign of a potential trend reversal to the downside. The pattern is marked by a bullish candle followed by a bearish candle that opens above the previous day’s high and closes deep into the previous day’s real body.
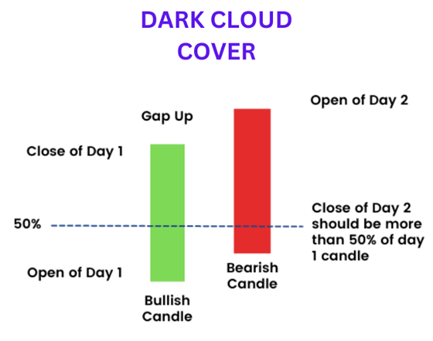
Identifying the Dark Cloud Cover Candlestick Pattern
To recognize the Dark Cloud Cover pattern, traders should focus on the following key elements:
- Uptrend: The pattern typically forms within the context of an ongoing uptrend, signaling a potential change in market sentiment.
- First Candle: The first candlestick is a bullish one, representing the continuation of the uptrend.
- Second Candle: The second candlestick is bearish and opens above the high of the previous day. It then closes significantly into the real body of the first candle.
Interpreting the Dark Cloud Cover Pattern:
The Dark Cloud Cover pattern carries important interpretations based on its context:
- Reversal Signal: When the Dark Cloud Cover appears after a strong uptrend, it serves as a strong bearish reversal signal. It suggests that bullish momentum may be waning, and a bearish trend could be emerging.
- Market Sentiment Shift: The pattern highlights a shift from bullish to bearish sentiment as the second bearish candle engulfs a significant portion of the previous day’s gains.
- Confirmation: Traders often seek additional confirmation through volume analysis, trendline analysis, or other technical indicators before making trading decisions based on the Dark Cloud Cover.
Trade Execution and Risk Management:
When a Hammer pattern is confirmed and occurs after a downtrend, traders may consider opening long positions or tightening stop-loss levels on existing short positions. Sound risk management practices, including the use of stop-loss orders, are essential to protect against potential losses.
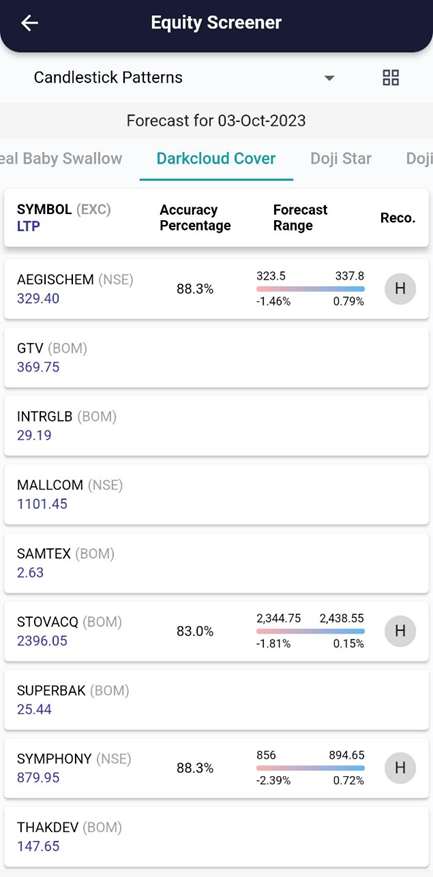
xCalData analyses the candles of individual stocks daily and identifies the stocks forming various patterns. Checkout xCalData app to know all the candle stick patterns formed by the stock of your interest.
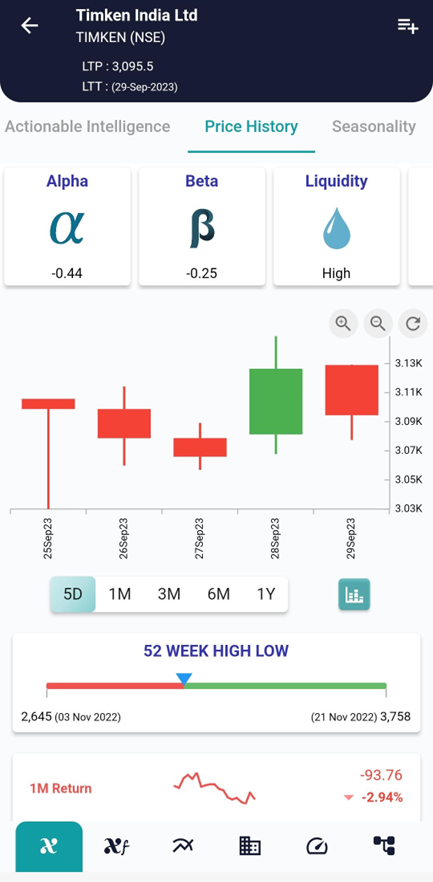
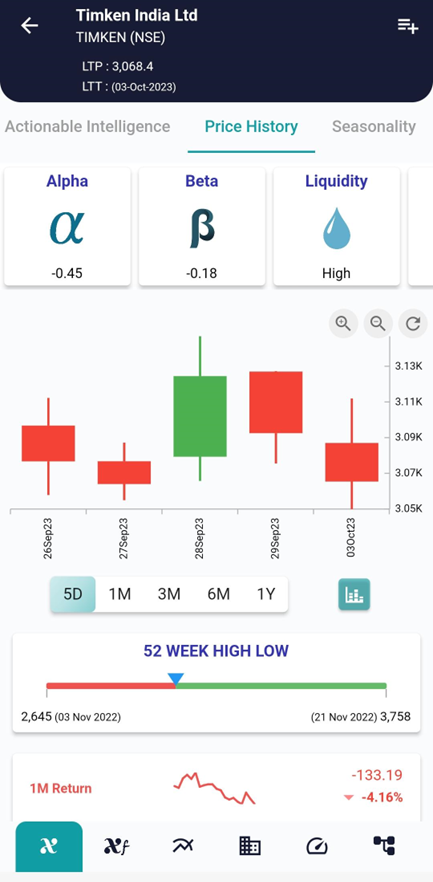
Example, on 29 Sep the stock showed the Dark Cloud Cover Candlestick Pattern and on 03 Oct the stock started going down as can be seen in the interpretation above.
Conclusion:
The Dark Cloud Cover candlestick pattern is a powerful tool in the trader’s toolkit, offering insights into potential trend reversals. However, like all trading signals, it should be used judiciously, alongside comprehensive analysis and risk management strategies. Successful trading demands a deep understanding of candlestick patterns and adaptability to changing market conditions.
Trading always involves risk, and it is crucial to develop a well-rounded trading strategy, including risk management techniques, to increase your productivity and achieve long-term success in the financial markets, Visit and download xCalData.
Where can I see further insights on this stock?
xCalData offers unbiased insights into stocks. Download the app from google play. For Actionable Intelligence, subscribe to xCalData app on Android devices: Download here
Disclaimer: The securities quoted are for illustration only and are not recommendatory.
Popular Posts
-
Stock of Interest . August 23, 2024
#HSCL (NSE) Stock Report | 23 Aug 2024
-
Stock of Interest . August 23, 2024
Add Zerodha trading account to xCalData
-
Stock of Interest . August 23, 2024
What is xCalData , how to use it and how accurate is it?
-
Stock of Interest . August 23, 2024
Jurik Moving Average (JMA): A Profit Trading Insight