Knowledge Base
Posted On: January 29, 2024
Decoding the Dynamics of Technical Indicators: A Comprehensive Guide
In the intricate realm of financial markets, technical indicators stand as beacons, guiding traders through the labyrinth of price movements and market trends. These analytical tools, rooted in mathematical calculations and statistical data, provide invaluable insights into the past, present, and potentially future behavior of financial instruments. This comprehensive guide seeks to unravel the multifaceted world of technical indicators, shedding light on their significance, categories, and real-world applications.
Understanding Technical Indicators
Definition:
Technical indicators are mathematical calculations derived from historical price, volume, or open interest data. Their primary purpose is to aid traders in making informed decisions by providing visual representations of market behavior. These indicators transform raw market data into comprehensible charts, patterns, and signals.
Significance:
- Trend Identification:
- Technical indicators assist in identifying trends, whether they are bullish, bearish, or range-bound. This aids traders in aligning their strategies with prevailing market conditions.
- Volatility Measurement:
- Volatility indicators gauge the degree of price fluctuations. Understanding market volatility is crucial for risk management and setting appropriate stop-loss levels.
- Momentum Assessment:
- Momentum indicators evaluate the strength and speed of price movements. They help traders identify potential trend reversals or continuations.
- Overbought and Oversold Conditions:
- Oscillators, a subset of technical indicators, reveal when an asset is overbought or oversold. These conditions often precede reversals, providing trading opportunities.
Categories of Technical Indicators(Examples):
1. Trend Indicators:
- Moving Averages: Smooth out price data to create trend-following indicators.
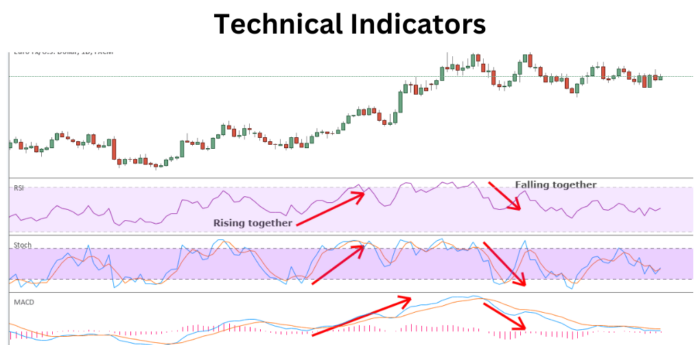
- MACD (Moving Average Convergence Divergence): Measures the difference between two moving averages.
2. Oscillators:
- Relative Strength Index (RSI): Measures the magnitude of recent price changes to evaluate overbought or oversold conditions.
- Stochastic Oscillator: Compares a closing price to a price range over a specific period.
3. Volatility Indicators:
- Bollinger Bands: Depict volatility by surrounding the price with upper and lower bands.
- Average True Range (ATR): Measures market volatility by considering the range between high and low prices.
4. Volume Indicators:
- On-Balance Volume (OBV): Relates volume to price movements, helping identify accumulation or distribution.
- Chaikin Money Flow (CMF): Measures the volume flow relative to price movements.
Real-World Application
Scenario:
A trader observes a stock showing an upward trend, supported by strong buying volume and a rising RSI indicating momentum. Simultaneously, Bollinger Bands widen, signifying increased volatility.
Interpretation:
The combination of a strong trend, high buying interest, and elevated volatility may suggest a robust bullish trend. However, the trader should consider potential overbought conditions and be cautious of a reversal.
Conclusion: Navigating Markets with Precision
As traders navigate the vast expanse of financial markets, technical indicators serve as invaluable tools, offering nuanced perspectives on price movements and trends. The key lies not only in understanding individual indicators but also in synthesizing multiple signals to form a comprehensive view. In the dynamic and unpredictable world of finance, mastering the art of technical analysis equips traders with the skills needed to make informed decisions and thrive in ever-changing market conditions.
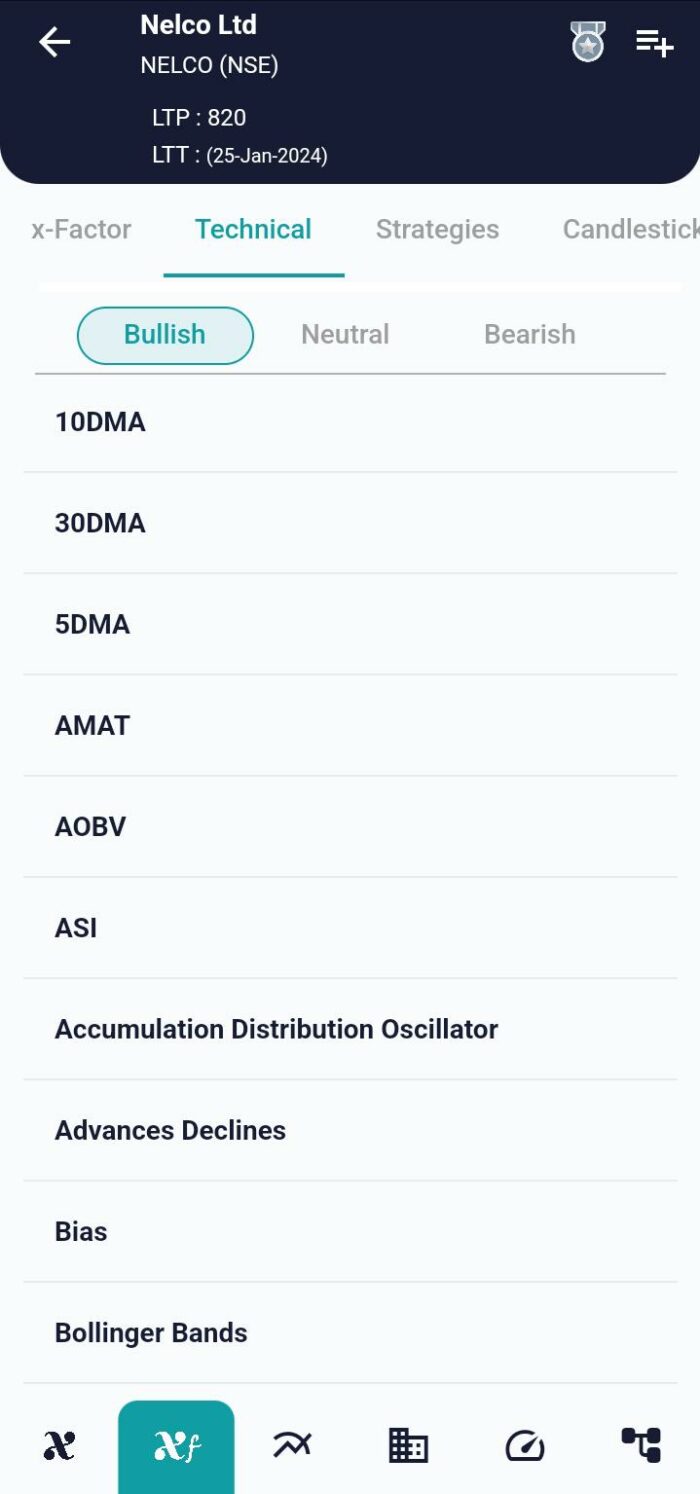
xCalData is an exceptional app available for Android devices that offers unbiased insights into stocks, allowing investors to make informed decisions. With its user-friendly interface and comprehensive features, xCalData provides a valuable resource for anyone interested in the stock market. Download the app from google play.
For Actionable Intelligence, subscribe to xCalData app on Android devices: https://tinyurl.com/downloadxCalData
Popular Posts
-
Stock of Interest . August 23, 2024
#HSCL (NSE) Stock Report | 23 Aug 2024
-
Stock of Interest . August 23, 2024
Add Zerodha trading account to xCalData
-
Stock of Interest . August 23, 2024
What is xCalData , how to use it and how accurate is it?
-
Stock of Interest . August 23, 2024
Jurik Moving Average (JMA): A Profit Trading Insight