Technical Indicator
Posted On: January 29, 2024
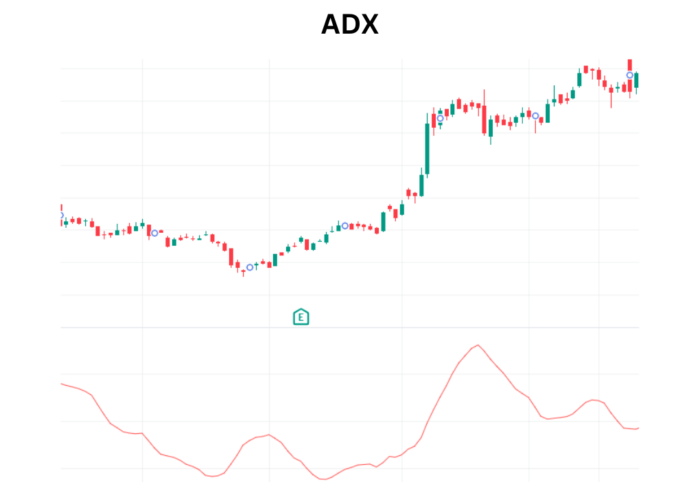
Decoding Trend Strength with ADX Indicator
In the dynamic realm of financial markets, traders constantly seek tools that help quantify the strength of a trend. The Average Directional Index (ADX) stands as a reliable technical indicator for precisely that purpose. This blog post will delve into the intricacies of the ADX indicator, including its mathematical calculations, interpretations, and the significance it holds in navigating trends across various trading instruments.
Introduction:
The Average Directional Index (ADX) serves as a robust tool for quantifying the strength of a trend in financial markets. Whether traders are dealing with stocks, mutual funds, exchange-traded funds, or futures, the ADX can provide valuable insights into the prevailing trend’s intensity. Calculated based on the moving average of price range expansion over a specified period, the ADX is a versatile indicator used by traders worldwide.
Mathematical Formula:
The ADX is derived from a series of calculations involving the Average True Range (ATR), Exponential Moving Average (EMA), and the Directional Movement components. The mathematical formula for ADX involves the following steps:
ADX=RMA(DX)
Where:
+DI= ((Smoothed + DM)/ATR) *100
-DI= ((Smoothed – DM)/ATR) *100
DX= (|+DI+-DI| / |+DI—DI|) ×100
ATR = Average True Index
Smoothed=EMA of 14 periods.
Interpretations:
The ADX value provides a clear indication of the strength of the prevailing trend. Traders can interpret the ADX value as follows:
- 0-25: Absent or Weak Trend An ADX value in this range suggests a lack of a significant trend or a weak trend in the market.
- 25-50: Moderate Trend Strength An ADX value between 25 and 50 indicates a moderate level of trend strength, suggesting a more defined directional movement.
- 50-75: Strong Trend ADX values in this range represent a strong trend, signaling a robust and well-established directional movement.
- 75-100: Very Strong Trend The highest range of ADX values suggests an extremely strong trend, indicating a powerful and sustained directional movement in the market.
Real-World Application:
Traders can apply the ADX indicator in various scenarios. For instance, if the ADX value is below 25, it might signal a period of consolidation or a weak trend, providing caution to trend-seeking traders. On the other hand, an ADX value above 50 could signify a strong trend, prompting traders to consider trend-following strategies.
Conclusion: Navigating Trends with Confidence
In conclusion, the ADX indicator empowers traders with a quantitative measure of trend strength, allowing them to navigate the intricate landscape of financial markets with confidence. As traders leverage the insights from the ADX, it becomes an invaluable tool for decision-making, aiding in the identification of potential trend opportunities and the assessment of market dynamics.
xCalData is an exceptional app available for Android devices that offers unbiased insights into stocks, allowing investors to make informed decisions. With its user-friendly interface and comprehensive features, xCalData provides a valuable resource for anyone interested in the stock market. Download the app from google play.
For Actionable Intelligence, subscribe to xCalData app on Android devices: https://tinyurl.com/downloadxCalData
Popular Posts
-
Stock of Interest . August 23, 2024
#HSCL (NSE) Stock Report | 23 Aug 2024
-
Stock of Interest . August 23, 2024
Add Zerodha trading account to xCalData
-
Stock of Interest . August 23, 2024
What is xCalData , how to use it and how accurate is it?
-
Stock of Interest . August 23, 2024
Jurik Moving Average (JMA): A Profit Trading Insight