Technical Indicator
Posted On: February 9, 2024
Decoding Trends with Vortex Indicator (VI)
Introduction of Vortex Indicator:
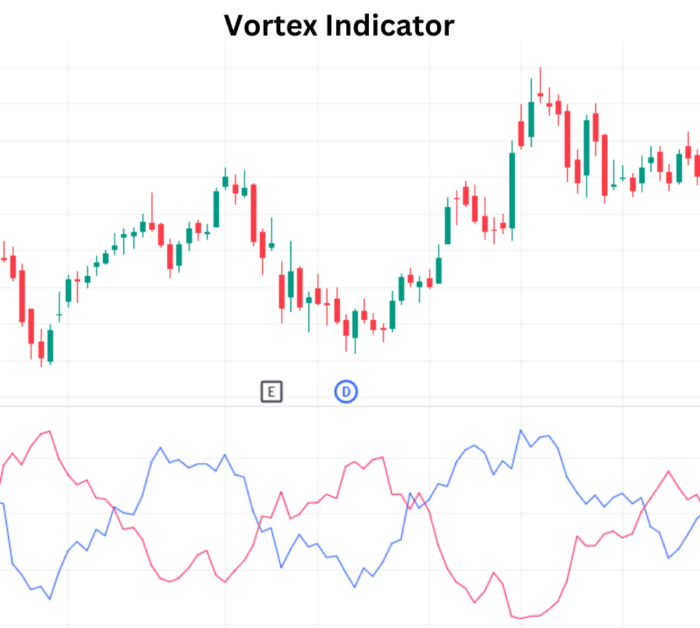
In the dynamic realm of financial markets, the ability to discern and confirm trends is paramount. The Vortex technical indicator (VI) emerges as a valuable tool in this pursuit, offering a dual-line approach to identify both uptrends and downtrends. With its distinctive green (VI+) and red (VI-) lines, the Vortex Indicator provides traders with a visual representation of trend strength and potential reversals.
Key Components:
- Dual Lines – VI+ and VI-:
- The Vortex Indicator consists of two essential lines – VI+ (uptrend indicator) and VI- (downtrend indicator).
- VI+ is often depicted in green, signaling positive price movement and potential uptrends.
- VI-, represented in red, denotes negative price movement and serves as an indicator for potential downtrends.
- Trend Reversals and Confirmations:
- The primary role of the Vortex Indicator is to identify trend reversals and validate existing trends.
- Traders observe the relationship between VI+ and VI- to gauge the prevailing market sentiment.
Mathematical formula:
VORTEX Positive=sum (high-Prev low) N periods / sum (True range) N periods
VORTEX Negative= sum (low -Prev high) N periods / sum (True range) N periods
Where, N=14
Interpretation Framework:
- Bullish Signal – VI+ Dominance:
- When VI+ (green line) surpasses VI- (red line), it signals a bullish trend.
- This scenario suggests that positive price movements and uptrends are gaining strength, prompting traders to consider bullish positions.
- Bearish Signal – VI- Dominance:
- Conversely, when VI- (red line) outpaces VI+ (green line), it indicates a bearish trend.
- The dominance of negative price movements suggests potential downtrends, prompting traders to exercise caution and consider bearish positions.
Visual Cues and Decision-Making:
- Color-Coded Visualization:
- The color-coded representation of VI+ and VI- enhances the visual interpretation of trends.
- Green and red lines provide traders with an intuitive understanding of the prevailing market dynamics.
- Confirmation of Trends:
- Traders use the Vortex Indicator not only for trend identification but also for trend confirmation.
- When the relationship between VI+ and VI- aligns with price movements, it reinforces the confidence in the current market trend.
Conclusion:
In the intricate tapestry of market analysis, the Vortex Indicator stands out as a tool that brings clarity to trend dynamics. Its dual-line structure, accompanied by color-coded visuals, simplifies the process of identifying and confirming trends. Whether signaling bullish strength with VI+ dominance or cautioning against bearish trends with VI- dominance, this indicator equips traders with valuable insights.
As markets evolve and trends undergo transitions, the Vortex Indicator serves as a reliable companion for traders seeking to navigate with precision. By embracing both the green and red lines of VI, traders can align their strategies with the ever-changing currents of financial markets.
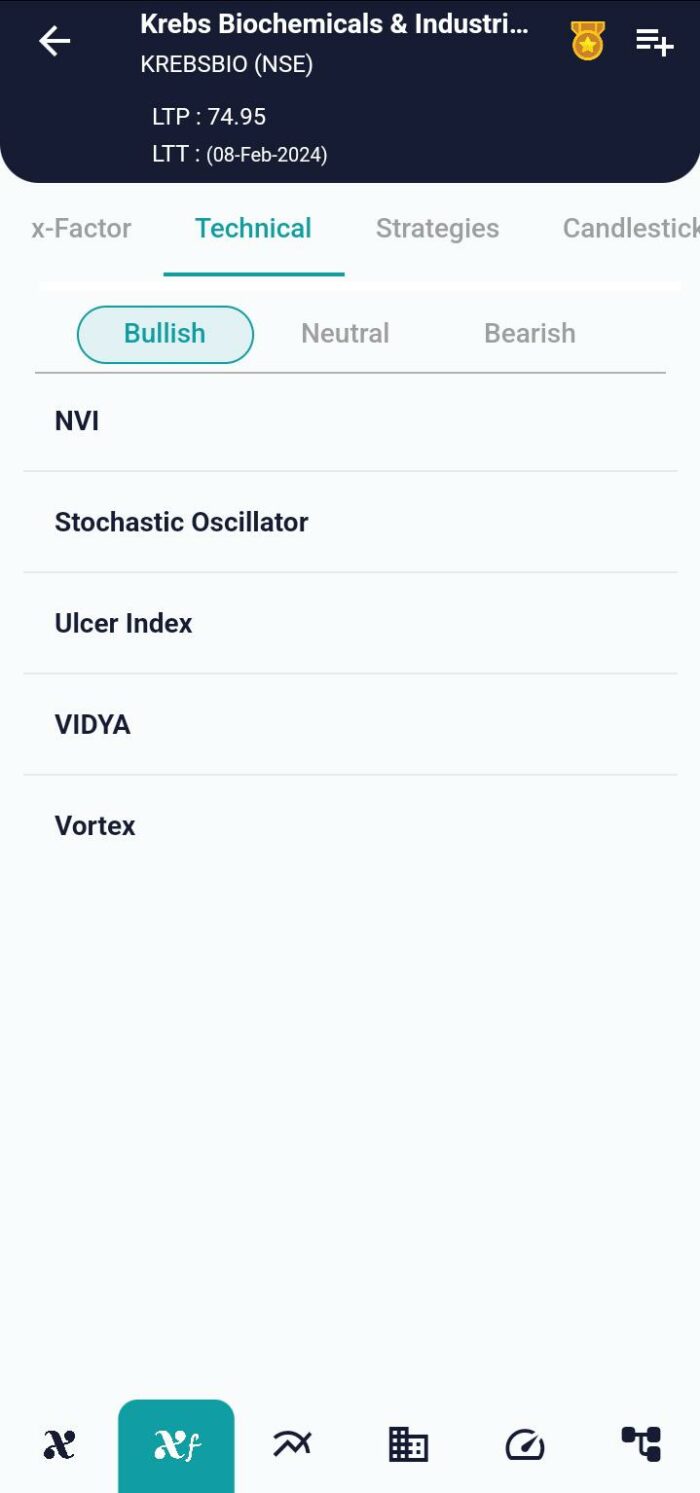
xCalData is an exceptional app available for Android devices that offers unbiased insights into stocks, allowing investors to make informed decisions. With its user-friendly interface and comprehensive features, xCalData provides a valuable resource for anyone interested in the stock market. Download the app from google play.
For Actionable Intelligence, subscribe to xCalData app on Android devices: https://tinyurl.com/downloadxCalData

Popular Posts
-
Stock of Interest . August 23, 2024
#HSCL (NSE) Stock Report | 23 Aug 2024
-
Stock of Interest . August 23, 2024
Add Zerodha trading account to xCalData
-
Stock of Interest . August 23, 2024
What is xCalData , how to use it and how accurate is it?
-
Stock of Interest . August 23, 2024
Jurik Moving Average (JMA): A Profit Trading Insight