Technical Indicator
Posted On: February 5, 2024
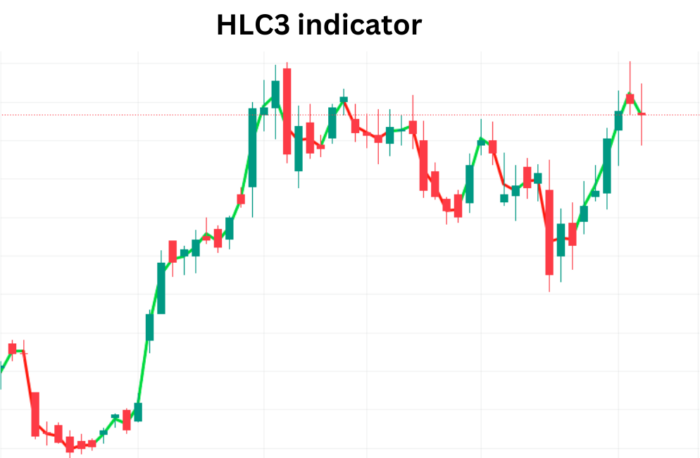
Demystifying HLC3 Indicator : A Simple Guide
Unveiling HLC3 Indicator: High-Low-Close Average Decoded
In the vast landscape of technical analysis, the HLC3 technical indicator takes center stage as a straightforward yet potent tool. Representing High-Low-Close 3, this indicator revolves around the average of high, low, and close prices. Join us as we delve into the intricacies of the HLC3 indicator and decode the signals it sends to traders.
Understanding HLC3: High-Low-Close Average at a Glance
1. HLC3 Calculation:
- HLC3 Indicator is calculated by taking the average of high, low, and close prices within a specified period.
- Formula: HLC3 = (High + Low + Close) / 3
2. Bullish Signal: Rising HLC3 Value
- Interpretation: An ascending HLC3 value signifies an uptrend in prices.
- Buy Signal: Traders may interpret this as a buy signal, anticipating a continuation of the upward trend.
3. Bearish Signal: Falling HLC3 Value
- Interpretation: A descending HLC3 value indicates a potential downtrend.
- Sell Signal: Traders might view this as a sell signal, suggesting a possible reversal or continuation of the downward trend.

Integrating HLC3 into Your Trading Strategy
1. Confirmation with Other Indicators:
- Validate HLC3 Indicator signals by cross-referencing with complementary indicators like moving averages or momentum oscillators.
- Confirmatory signals enhance the reliability of trading decisions.
2. Adapting to Market Conditions:
- Adjust the period of HLC3 Indicator calculation based on prevailing market conditions.
- Shorter periods for agile response in volatile markets and longer periods for capturing smoother trends.
3. Risk Management Strategies:
- Integrate HLC3 Indicator signals into your risk management approach.
- Set stop-loss and take-profit levels based on HLC3 insights to mitigate potential losses and secure gains.
HLC3 in Action: A Practical Scenario
Let’s envision a scenario where HLC3 Indicator comes into play:
- Scenario:
- HLC3 Uptrend: Over a specified period, HLC3 Indicator values exhibit a consistent upward trajectory.
- Interpretation: Traders may interpret this as a bullish signal, expecting the upward momentum to persist.
- Action: Consider entering long positions or holding existing long positions.
- Scenario:
- HLC3 Downtrend: HLC3 values display a continuous decline.
- Interpretation: Traders might view this as a bearish signal, anticipating a sustained downtrend.
- Action: Evaluate potential short positions or manage existing short positions.
Conclusion: HLC3 as Your Trend Navigator
Incorporating HLC3 Indicator into your trading arsenal brings forth a blend of simplicity and effectiveness. By focusing on the average of high, low, and close prices,HLC3 Indicator distills market trends into clear signals. Whether you’re a novice trader or an experienced investor, mastering the art of interpreting HLC3 signals can amplify your decision-making prowess in the ever-evolving realm of financial markets.
xCalData is an exceptional app available for Android devices that offers unbiased insights into stocks, allowing investors to make informed decisions. With its user-friendly interface and comprehensive features, xCalData provides a valuable resource for anyone interested in the stock market. Download the app from google play.
For Actionable Intelligence, subscribe to xCalData app on Android devices: https://tinyurl.com/downloadxCalData
Popular Posts
-
Stock of Interest . August 23, 2024
#HSCL (NSE) Stock Report | 23 Aug 2024
-
Stock of Interest . August 23, 2024
Add Zerodha trading account to xCalData
-
Stock of Interest . August 23, 2024
What is xCalData , how to use it and how accurate is it?
-
Stock of Interest . August 23, 2024
Jurik Moving Average (JMA): A Profit Trading Insight