Candlestick Pattern
Posted On: August 1, 2023
Demystifying the Three Outside Down Candlestick Pattern in Trading
Technical analysis heavily relies on candlestick patterns, providing traders with invaluable insights into market dynamics and potential trend reversals. Among these crucial patterns is the Three Outside Down, which holds significant importance for traders seeking bearish signals. In this blog post, we will delve into the characteristics of the Three Outside Down pattern, elucidate the methods for identifying and interpreting it, and explore its implications for refining trading strategies.
The Three Outside Down pattern is a three-candlestick formation that typically occurs at the end of an uptrend. It suggests that the bulls’ control might be waning, potentially leading to a bearish reversal. The pattern consists of a bullish candlestick followed by two bearish candlesticks. The second bearish candlestick “engulfs” the previous day’s bullish candlestick, while the third bearish candlestick closes below the first day’s low.

Characteristics of Three Outside Down:
To accurately identify the Three Outside Down pattern, traders should closely observe the following key features:
- Previous Trend: This pattern emerges after an uptrend, signaling a potential trend reversal.
- First Candle: The first candle represents a bullish candlestick, signifying the continuation of the existing uptrend.
- Second Candle: A bearish candle follows, closing below the low of the first candle. This suggests a potential weakening of the bullish momentum.
- Third Candle: The third candle is another bearish candle that closes below the low of the second candle, confirming the trend reversal and indicating strong bearish sentiment.
Interpreting the Three Outside Down Pattern:
The Three Outside Down pattern indicates a potential shift in market sentiment from bullish to bearish. The consecutive lower closes reinforce the bearish reversal, reflecting an increase in selling pressure.
Confirmation and Trading Strategies:
While the Three Outside Down pattern provides a possible bearish signal, traders often seek additional confirmation before executing trades. The following factors contribute to this confirmation:
- Volume Confirmation: Higher trading volume accompanying the pattern’s formation strengthens the validity of the potential trend reversal.
- Support and Resistance Levels: Identifying key support and resistance levels further validates the pattern and assists in establishing appropriate price targets.
- Technical Indicators: Combining the Three Outside Down pattern with other technical indicators, such as moving averages or the MACD, can provide supplementary confirmation and enhance trading decisions.

xCalData analyses the candles of individual stocks daily and identifies the stocks forming various patterns. Checkout xCalData app to know all the candle stick patterns formed by the stock of your interest.
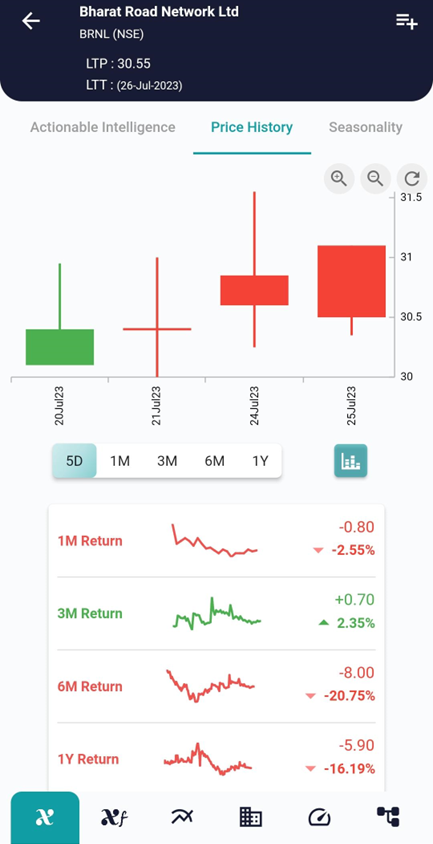
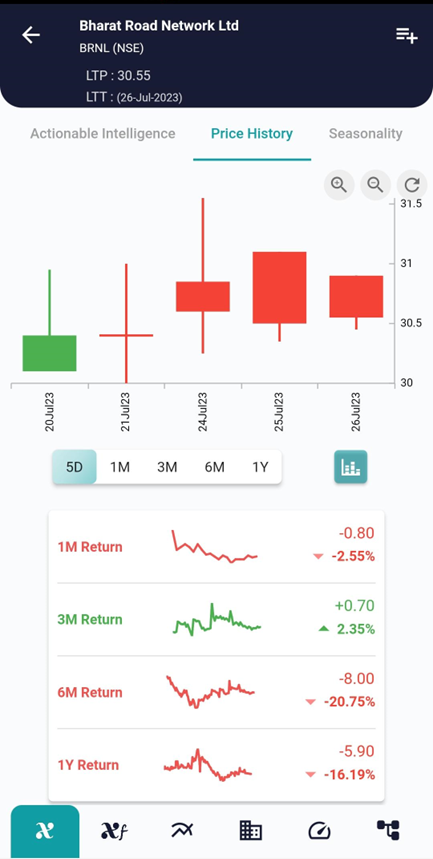
Example, on 25 July the stock showed the Three Outside down and on 26 July the stock started going down as can be seen in the charts above.
Conclusion:
The Three Outside Down pattern serves as a potent tool for traders, offering insights into potential trend reversals from bullish to bearish. By comprehending its characteristics and adeptly identifying this pattern, traders can enhance their trading strategies.
However, it is essential to bear in mind that no pattern guarantees success, and additional confirmation and thorough analysis are necessary for making well-informed trading decisions.
Trading always involves risk, and it is crucial to develop a well-rounded trading strategy, including risk management techniques, to increase your productivity and achieve long-term success in the financial markets, Visit and download xCalData.
Where can I see further insights on this stock?
xCalData offers unbiased insights into stocks. Download the app from google play. For Actionable Intelligence, subscribe to xCalData app on Android devices: Download here

Disclaimer: The securities quoted are for illustration only and are not recommendatory.
Popular Posts
-
Stock of Interest . August 23, 2024
#HSCL (NSE) Stock Report | 23 Aug 2024
-
Stock of Interest . August 23, 2024
Add Zerodha trading account to xCalData
-
Stock of Interest . August 23, 2024
What is xCalData , how to use it and how accurate is it?
-
Stock of Interest . August 23, 2024
Jurik Moving Average (JMA): A Profit Trading Insight