Technical Indicator
Posted On: January 31, 2024
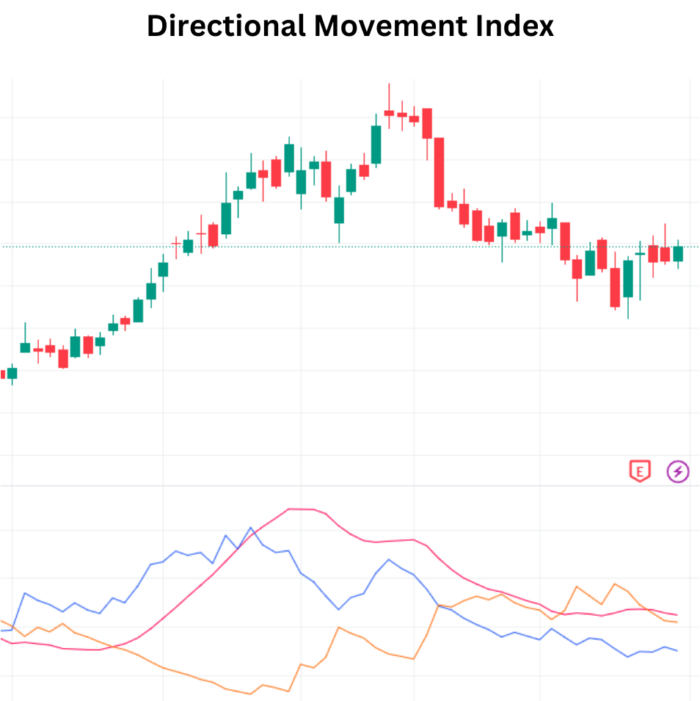
Directional Movement Index (DMI) – Navigate Markets Confidently
Unveiling the Power of DMI: Navigating Price Direction
In the vast landscape of financial markets, understanding the trajectory of asset prices is paramount. Introduced by J. Welles Wilder in 1978, the Directional Movement Index (DMI) emerges as a key technical indicator , shedding light on the prevailing market trends. Let’s delve into the essence of DMI and decipher its interpretation for astute trading decisions.
Mathematical formula:
The formula for DMI (Directional Movement Index) can be expressed as:
+DI= (Smoothed +DM) / ATR ×100
-DI= (Smoothed -DM) / ATR ×100
DX=(∣+DI+-DI∣/∣+DI−-DI∣) ×100
where:
+DM (Directional Movement) = Current High−PH
PH=Previous high
-DM=Previous Low−Current Low
Smoothed +/-DM= − +CDM
ATR = Average True Range
CDM=Current DM
Grasping the Basics: Anatomy of DMI
- Components of Directional Movement Index:
- Positive Directional Movement Line (+DI): Traces the upward pressure in the price by comparing previous highs.
- Negative Directional Movement Line (-DI): Charts the downward pressure in the price by assessing previous lows.
- Average Directional Index (ADX): An optional third line gauging the strength of trends.
- Comparing +DI and -DI:
- When +DI surpasses -DI, it signals more upward pressure, indicating a potential bullish trend.
- If -DI eclipses +DI, it denotes heightened downward pressure, suggesting a potential bearish trend.
Decoding Directional Movement Index : A Tactical Approach
- Bullish Momentum:
- When +DI outshines -DI, the prevailing bullish momentum signifies a potential opportunity for traders to consider long positions.
- Bearish Momentum:
- A dominance of -DI over +DI points to bearish momentum, prompting traders to assess short positions or implement risk management strategies.
Navigating Trends: DMI Interpretation
Interpreting DMI unfurls through the interplay of +DI and -DI:
- Bullish Trend:
- If +DI eclipses -DI, the Directional Movement Index Interpretation designates the market sentiment as “Bullish.”
- Bearish Trend:
- Conversely, if -DI surpasses +DI, the Directional Movement Index Interpretation characterizes the market sentiment as “Bearish.”
- Neutral Stance:
- In the absence of a clear dominance, signifying a balanced market, the DMI Interpretation marks the sentiment as “Neutral.”
Integrating DMI into Trading Strategies: A Holistic Approach
- Trend Confirmation:
- DMI serves as a robust tool to validate existing trends, allowing traders to align their strategies with the prevailing market sentiment.
- Dynamic Entry and Exit Points:
- Leveraging the insights from +DI and -DI, traders can strategically time their entries and exits, optimizing their risk-reward ratio.
Conclusion: Empowering Traders with DMI Precision
As traders navigate the ever-changing currents of financial markets, the Directional Movement Index stands as a beacon of clarity. Its nuanced interpretation of price pressures and trend strength equips traders with actionable insights. Whether you’re a seasoned trader or a novice investor, embracing the DMI empowers you to navigate market trends with confidence, ushering in a new era of strategic and informed trading decisions.
xCalData is an exceptional app available for Android devices that offers unbiased insights into stocks, allowing investors to make informed decisions. With its user-friendly interface and comprehensive features, xCalData provides a valuable resource for anyone interested in the stock market. Download the app from google play.
For Actionable Intelligence, subscribe to xCalData app on Android devices: https://tinyurl.com/downloadxCalData
Popular Posts
-
Stock of Interest . August 23, 2024
#HSCL (NSE) Stock Report | 23 Aug 2024
-
Stock of Interest . August 23, 2024
Add Zerodha trading account to xCalData
-
Stock of Interest . August 23, 2024
What is xCalData , how to use it and how accurate is it?
-
Stock of Interest . August 23, 2024
Jurik Moving Average (JMA): A Profit Trading Insight