Stock of Interest
Posted On: June 26, 2024
#DRREDDY (NSE) Stock Report | 26 Jun 2024
Outlook: Bullish
Sector: Healthcare
Industry: Pharmaceuticals & Biotechnology
About DRREDDY:
Dr. Reddy’s is one of the largest generic drug manufacturers in the world. It has a significant presence in North America, a region that makes up roughly half of its generics sales, and it services India (22% of its generics sales), Russia (12%), and certain European and Latin American countries. Beyond simple generics, Dr. Reddy’s also has a solid portfolio of injectables which make up 25% of its North America sales. In branded generic markets like India, Dr. Reddy’s has established a compelling presence with its strong brand name and earned a top five spot in key therapeutic areas including oncology and gastroenterology. Dr. Reddy’s also has an active pharmaceutical ingredient business that manufactures over 150 APIs and sells in over 75 countries.
Forecast and Trend of the Stock:
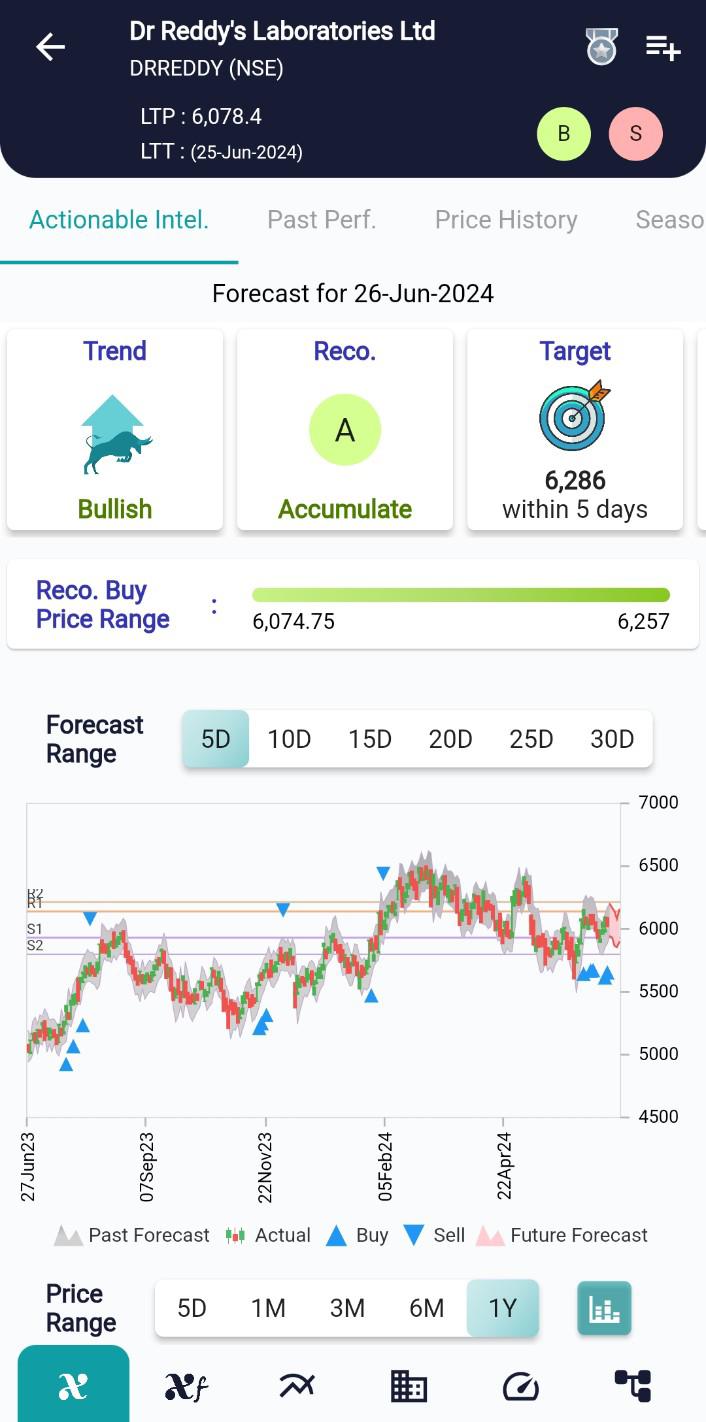
Forecasting in investment involves historical data and analysis to make predictions about future market trends, asset prices, and economic conditions. Investors utilize this tool to assess risks and opportunities, allocate their capital wisely, and determine the most suitable investment strategies. Additionally, forecasting helps investors adjust their portfolios to align with their financial goals and risk tolerance.
#xCalData predicts that #DRREDDY will continue its bullish phase over the next five days and trend within the range of 5855 to 6200.
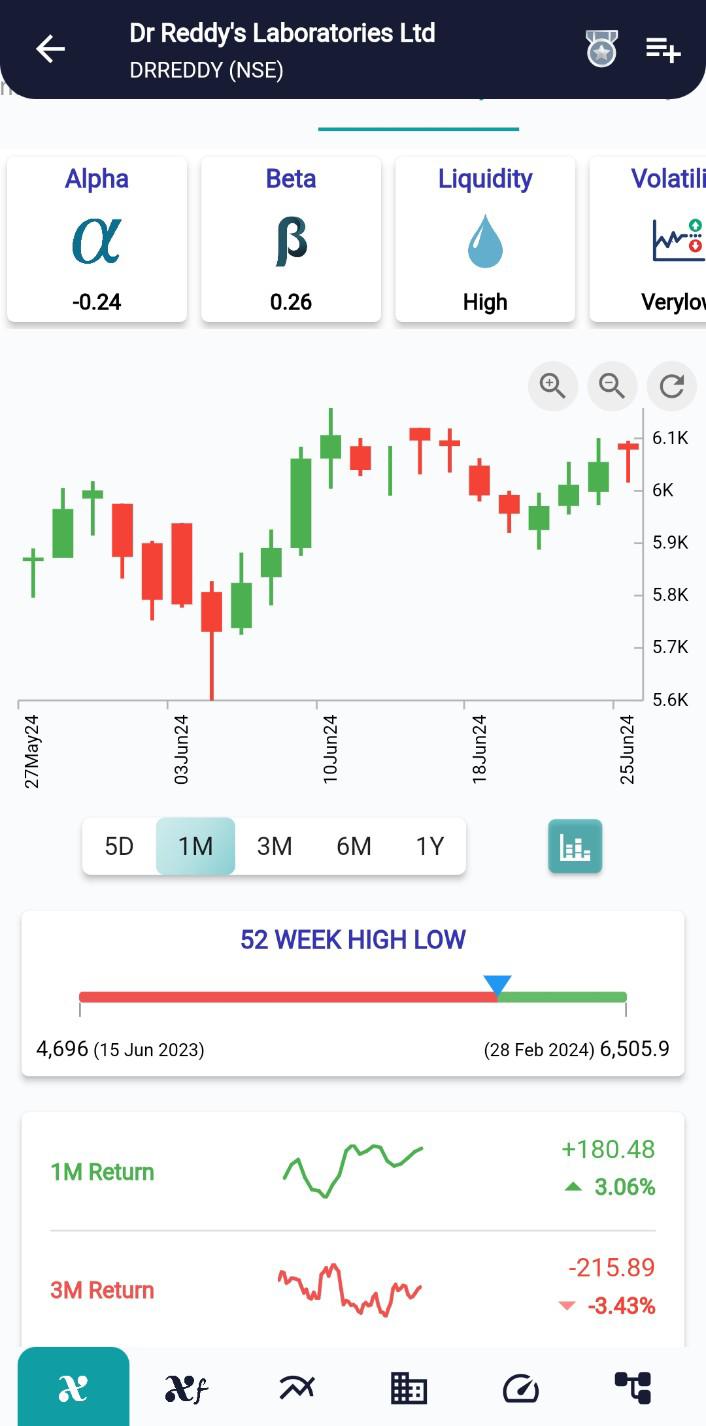
Price History of the Stock:
In comparison to the previous month, the price of the stock has experienced an increase of 3.06% indicating a bullish.
Historical stock prices can reveal patterns and trends that help investors make informed decisions. Studying past performance can provide valuable insights into potential future movements.
Historical Doubling Period:
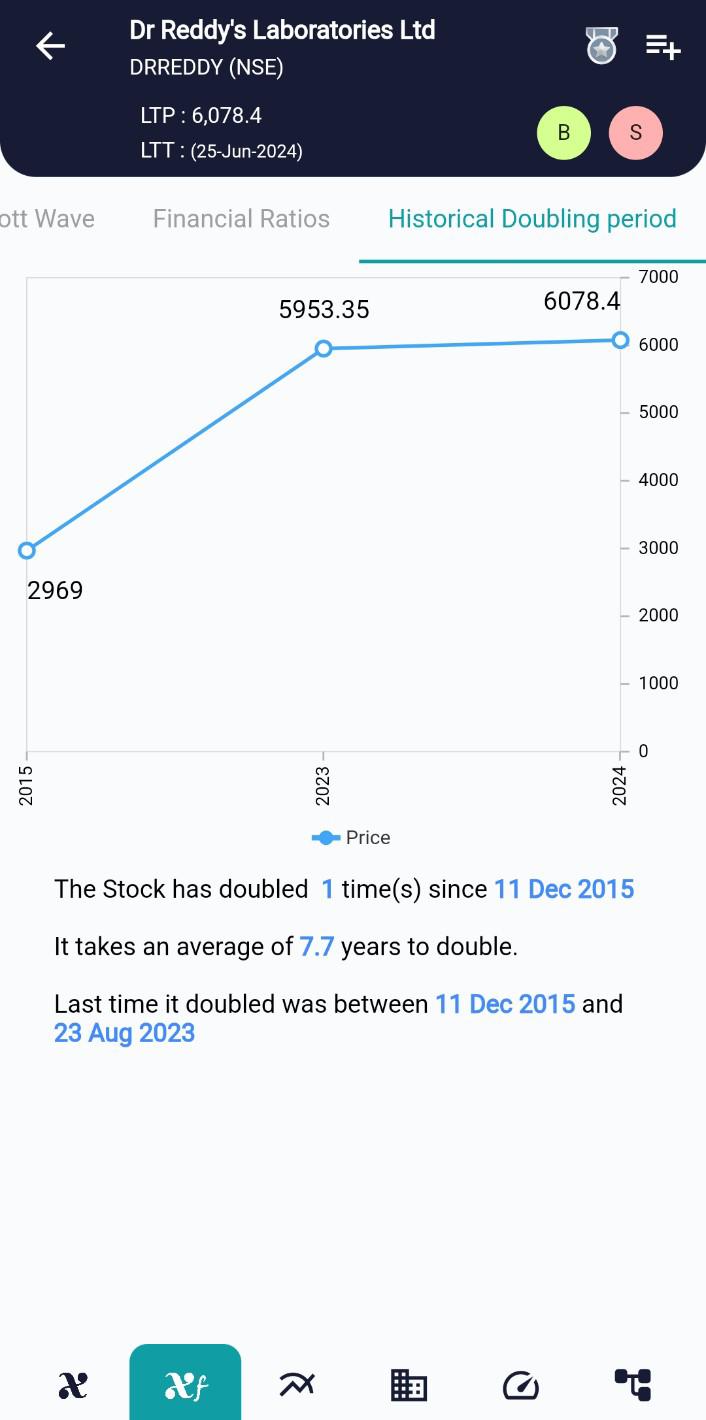
The DRREDDY Stock has doubled once since 11 Dec 2015 and took an average of 7.7 years to double.
The historical doubling period, within the realm of finance, serves as a metric to gauge the duration it took for an investment, whether it’s a stock or any other asset, to increase in value twofold over a specified historical timeframe. It provides valuable insight into the growth rate and performance of an investment during that specific period.
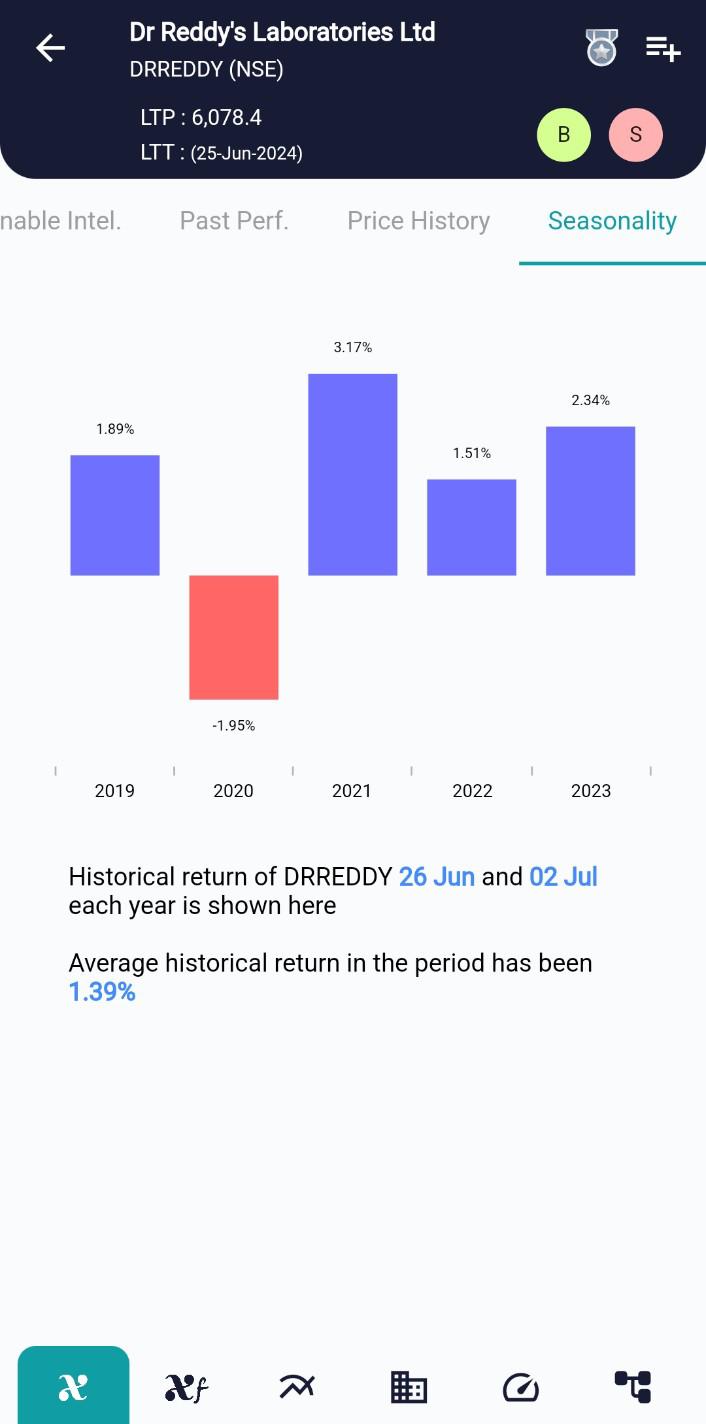
Seasonality:
The stock has shown seasonality trend in the past.
Reviewing the returns for the past 5 years for the same week, we see the stock has given negative returns in 1 years in the past.
Seasonality in the stock market is a fascinating phenomenon that has intrigued investors and analysts for generations. It involves the recurring patterns and trends in stock prices at specific times of the year. Understanding stock market seasonality can offer valuable insights for investors, guiding them in making informed decisions and optimizing their investment strategies. In this blog, we’ll explore what seasonality means in the context of the stock market and provide real-world examples to illustrate its significance.
Technical Indicators:
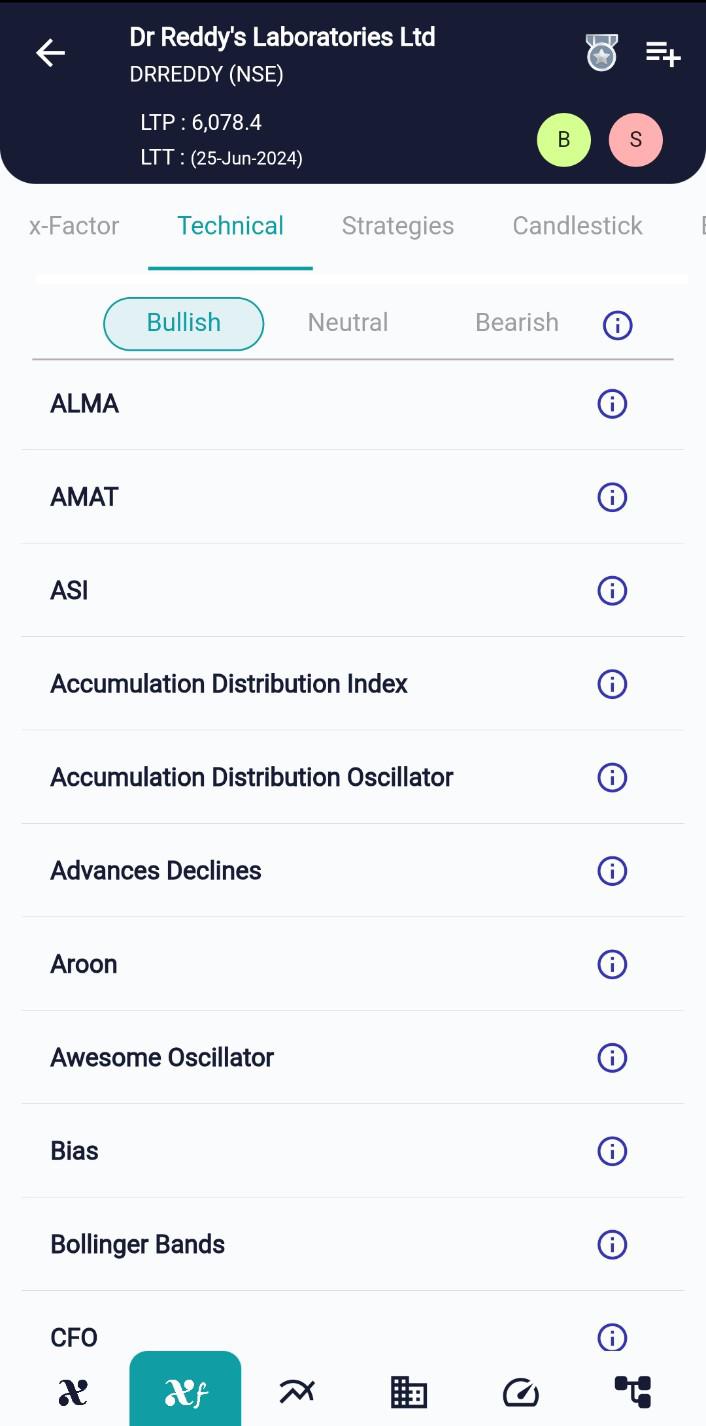
Majority of the technical ratios trend towards Bullish side of the spectrum. Only some of the technical indicators namely MFI indicate Bearish view.
Collectively, xCalData suggests the stock would be in Bullish zone for next 5 days.
Technical indicators are essential tools used in technical analysis to help traders and investors make informed decisions in the financial markets. These indicators are typically derived from price, volume, or open interest data and are used to forecast future price movements or trends. They offer valuable insights into market behavior and can assist in entry and exit points for trading strategies.
xCalData is an exceptional app available for Android devices that offers unbiased insights into stocks, allowing investors to make informed decisions. With its user-friendly interface and comprehensive features, xCalData provides a valuable resource for anyone interested in the stock market. Download the app from google play.
For Actionable Intelligence, subscribe to xCalData app on Android devices: https://tinyurl.com/downloadxCalData
Popular Posts
-
Stock of Interest . August 23, 2024
#HSCL (NSE) Stock Report | 23 Aug 2024
-
Stock of Interest . August 23, 2024
Add Zerodha trading account to xCalData
-
Stock of Interest . August 23, 2024
What is xCalData , how to use it and how accurate is it?
-
Stock of Interest . August 23, 2024
Jurik Moving Average (JMA): A Profit Trading Insight