Technical Indicator
Posted On: February 2, 2024
Elder Ray Index – Elevate Your Trading
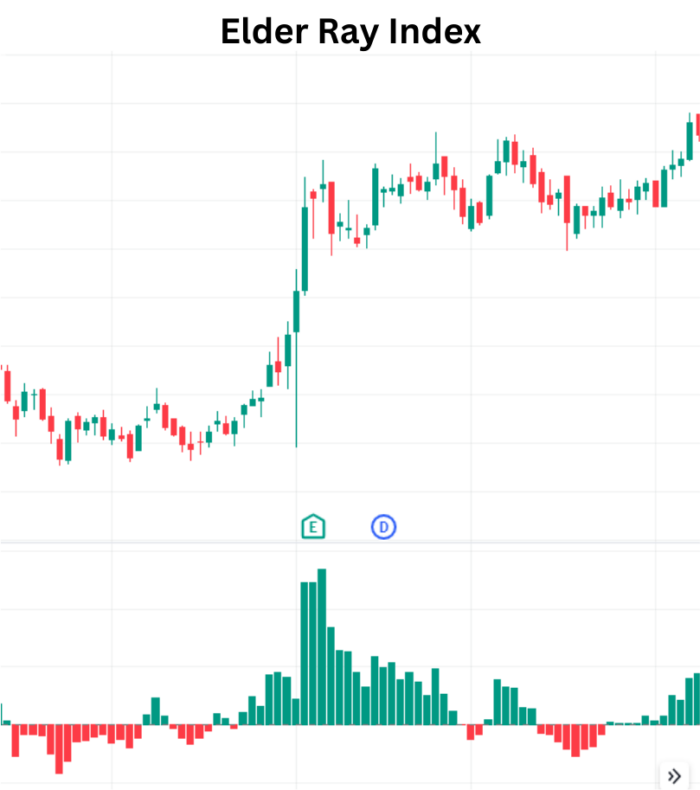
Traders look for instruments that will help them understand the complexity and reveal opportunities in the constantly changing financial markets. The Elder Ray Index was developed by prominent technical analyst Dr. Alexander Elder to evaluate the strength of bullish and bearish trends. This technical indicator, which consists of two main parts, Bull Power and Bear Power, provides traders with insightful information about market dynamics and helps them make well-informed decisions. Let’s examine the nuances of the Elder Ray Index and how traders can use it as a guide when navigating the markets.

Understanding the Components:
1. Bull Power:
Bull Power gauges the strength of bullish forces in the market. The calculation involves subtracting the exponential moving average (EMA) of the period’s low price from the period’s high price. The formula for Bull Power is:
Bull Power=High Price−EMA of Low PriceBull Power=High Price−EMA of Low Price
2. Bear Power:
Conversely, Bear Power assesses the strength of bearish forces. It is calculated by subtracting the EMA of the period’s high price from the period’s low price:
Bear Power=Low Price−EMA of High PriceBear Power=Low Price−EMA of High Price
Interpreting Elder Ray Index Signals:
Bullish Signals:
- Rising Bull Power: A surge in Bull Power indicates strengthening bullish forces in the market.
- Weakening Bear Power: Bear Power being in negative territory but showing signs of weakening.
- Upward Sloping EMA: The exponential moving average (EMA) exhibiting an upward slope.
- Bullish Divergence: Bull Power’s latest peak surpasses previous peaks, signaling a robust buy opportunity.
Bearish Signals:
- Falling EMA: A downward slope in the EMA.
- Above Zero Bull Power: Bull Power remains above zero but is on the decline.
- Falling Bear Power: Bear Power decreasing, indicating waning bearish strength.
- Bearish Divergence: Bear Power’s latest trough is deeper than previous troughs, signaling a potent selling opportunity.

Navigating Market Strategies:
1. Strength in Buy Signals:
- Rising Bull Power: Indicates increasing buying strength.
- Weakening Bear Power: A negative yet diminishing Bear Power adds weight to the bullish scenario.
2. Caution in Sell Signals:
- Falling EMA: A declining EMA suggests potential bearish trends.
- Above Zero Bull Power: Despite being above zero, a declining Bull Power calls for caution.
3. Divergences as Key Indicators:
- Bullish Divergence: A powerful signal for initiating or holding long positions.
- Bearish Divergence: Strong indications for entering or holding short positions.
Case Study: Applying Elder Ray Index in Action
Consider a scenario where Bull Power is on the rise, Bear Power is weakening but remains negative, and the EMA exhibits an upward slope. This alignment signals a potent bullish opportunity, prompting traders to consider long positions.
Conclusion: Empowering Traders with Elder Ray Wisdom
As traders navigate the intricacies of financial markets, the Elder Ray Index emerges as a valuable ally, providing nuanced insights into bullish and bearish forces. By keenly interpreting Bull Power, Bear Power, and associated signals, traders can enhance their market acumen and make well-informed decisions. The Elder Ray Index, with its unique blend of components, stands as a testament to Dr. Alexander Elder’s commitment to empowering traders with effective tools in the pursuit of market mastery.
xCalData is an exceptional app available for Android devices that offers unbiased insights into stocks, allowing investors to make informed decisions. With its user-friendly interface and comprehensive features, xCalData provides a valuable resource for anyone interested in the stock market. Download the app from google play.
For Actionable Intelligence, subscribe to xCalData app on Android devices: https://tinyurl.com/downloadxCalData
Popular Posts
-
Stock of Interest . August 23, 2024
#HSCL (NSE) Stock Report | 23 Aug 2024
-
Stock of Interest . August 23, 2024
Add Zerodha trading account to xCalData
-
Stock of Interest . August 23, 2024
What is xCalData , how to use it and how accurate is it?
-
Stock of Interest . August 23, 2024
Jurik Moving Average (JMA): A Profit Trading Insight