General
Posted On: February 15, 2024
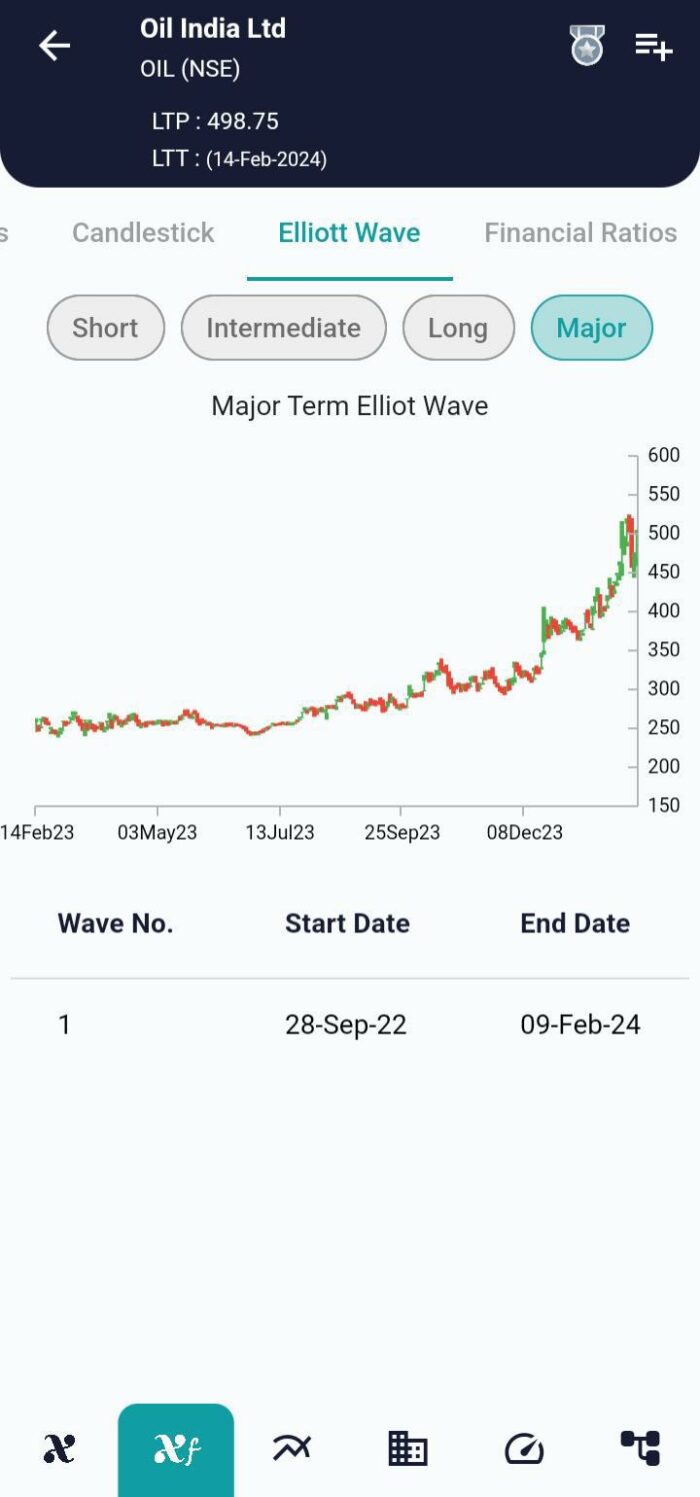
Elliott Wave Theory a Successful Trend Identifier
Introduction:
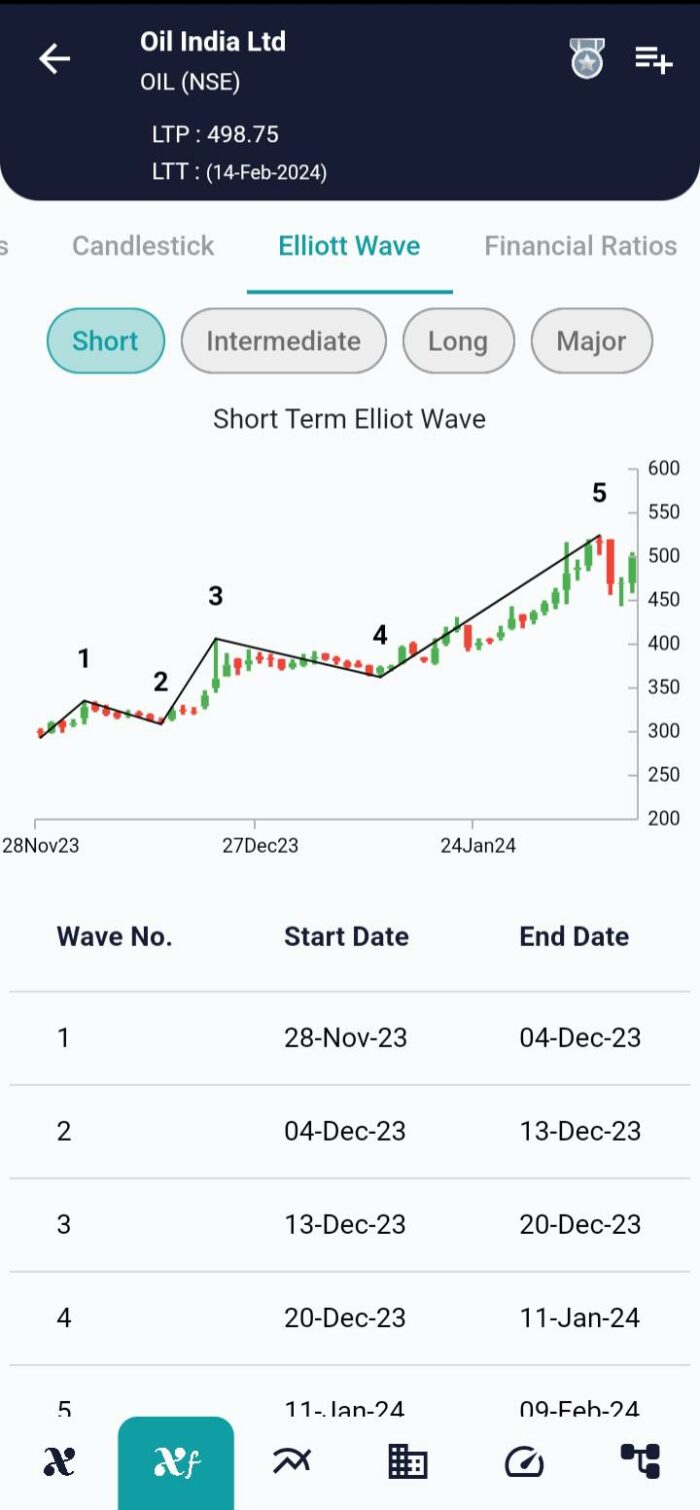
The Elliott Wave Theory, crafted by Ralph Nelson Elliott in the 1930s, stands as a fascinating approach to understanding market dynamics. Rooted in the observation of fractal wave patterns within stock price movements and investor behavior, this theory has become a cornerstone for many traders, portfolio managers, and private investors. Let’s delve into the intricacies of Elliott Wave Theory and explore how it shapes market analysis by using xCalData App.
Understanding the Elliott Wave Theory:
Ralph Nelson Elliott meticulously studied decades of market data across various timeframes, leading to the development of rules encapsulated in his Masterworks, published in 1994. While not providing absolute certainty about future price movements, the theory serves to organize probabilities for market actions. Elliott Wave International, a prominent financial analysis and forecasting firm, continues to leverage Elliott’s model for market insights.
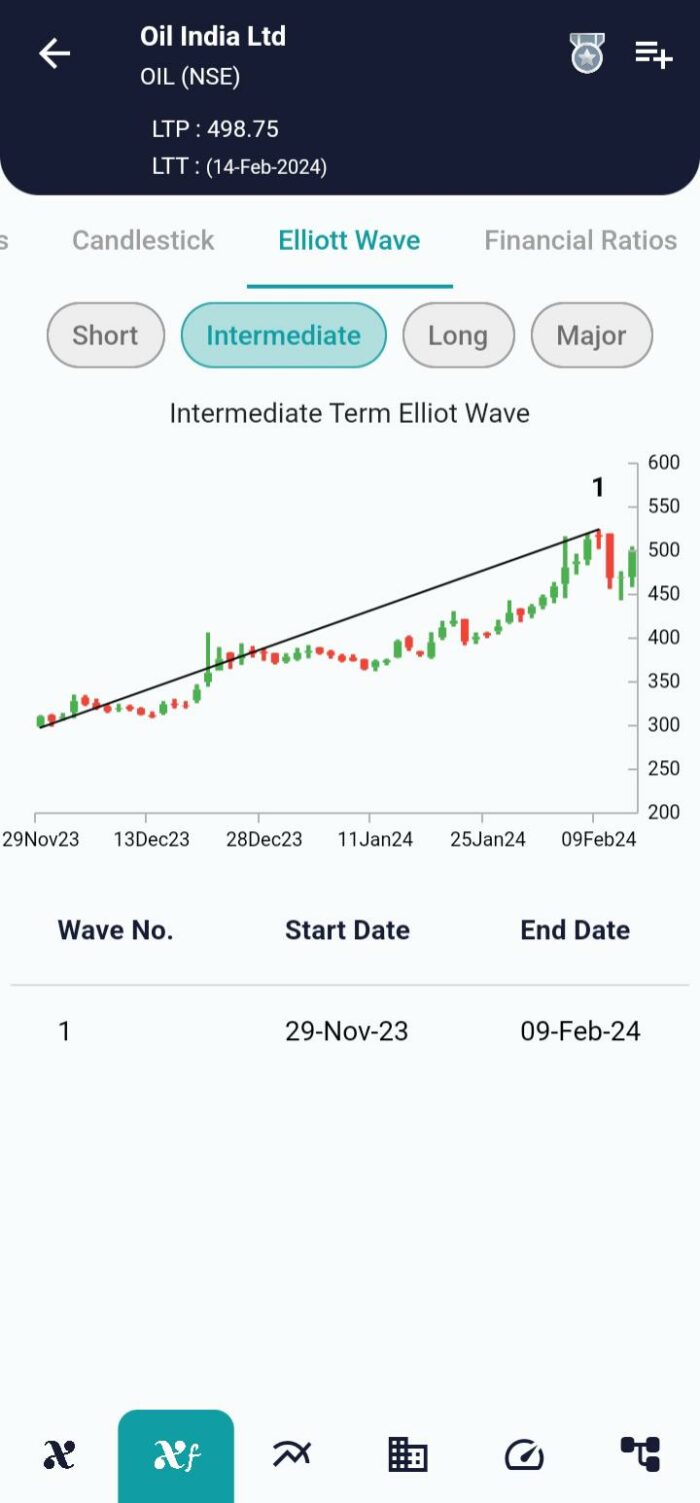
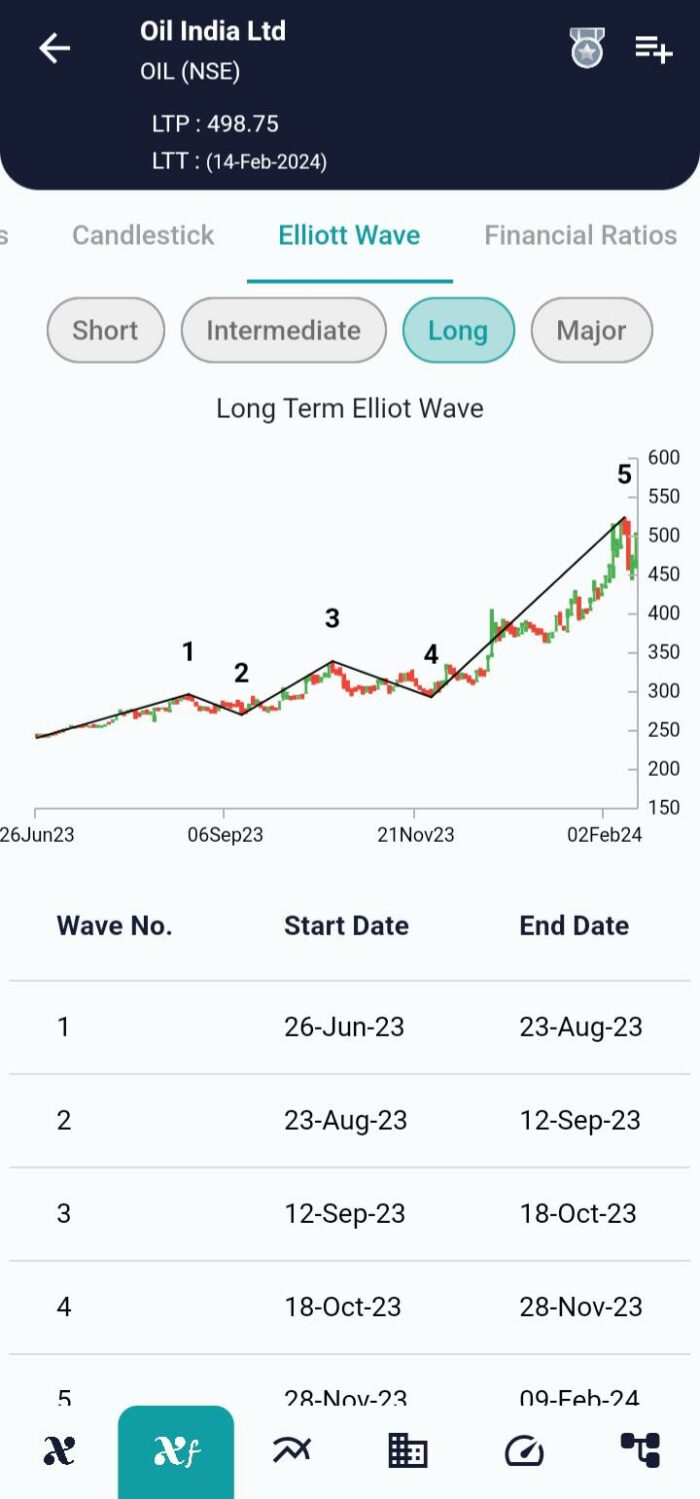
There are Four time intervals in Elliot Wave:
1.Short
2.Intermediate
3.Long
4.Moderate
How Elliott Waves Work:
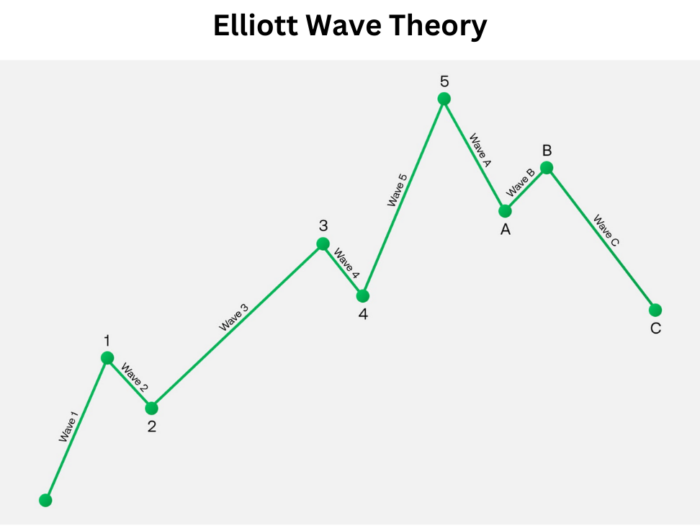
Elliott Wave Theory posits that stock price movements follow repetitive up-and-down patterns influenced by investor psychology and sentiment. It identifies two primary wave types: impulse waves and corrective waves. Unlike a rigid template, wave analysis offers insights into trend dynamics and aids in comprehending price movements.
Impulse Waves:
Impulse waves, the foundation of the Elliott Wave Theory, consist of five sub-waves moving in the same direction as the overall trend. These waves are categorized by specific rules, such as Wave 2 not retracing more than the beginning of Wave 1 and Wave 3 not being the shortest among the three impulse waves. Violating these rules prompts a re-evaluation of the wave structure.
Corrective Waves:
Corrective waves, also known as diagonal waves, aim to counter the trend of the next-largest degree. Comprising three sub-waves, corrective waves exhibit characteristics like forming a diagonal resembling either an expanding or contracting wedge. Notably, each sub-wave of the diagonal never fully retraces the previous sub-wave, adding complexity to wave analysis.
Fractal Approach:
Elliott Wave Theory adopts a fractal approach, wherein smaller sets of waves are nested within larger ones, adhering to the same impulse or corrective pattern. This approach allows for a nuanced understanding of market trends on different timeframes, enabling investors to navigate both short-term and long-term outlooks simultaneously.
Conclusion:
Incorporating Elliott Wave Theory into market analysis provides a unique lens to interpret price movements. While it requires a subjective understanding and careful observation, many investors find value in its ability to uncover the underlying dynamics of market trends. As with any technical analysis tool, combining Elliott Wave Theory with other methods enhances the overall decision-making process for traders and investors alike.
Where can I see further insights on this stock?
xCalData offers unbiased insights into stocks. Download the app from google play. For Actionable Intelligence, subscribe to xCalData app on Android devices: Download here
For Actionable Intelligence, subscribe to xCalData app on Android devices: https://tinyurl.com/downloadxCalData

Disclaimer: The securities quoted are for illustration only and are not recommendatory.
Popular Posts
-
Stock of Interest . August 23, 2024
#HSCL (NSE) Stock Report | 23 Aug 2024
-
Stock of Interest . August 23, 2024
Add Zerodha trading account to xCalData
-
Stock of Interest . August 23, 2024
What is xCalData , how to use it and how accurate is it?
-
Stock of Interest . August 23, 2024
Jurik Moving Average (JMA): A Profit Trading Insight