Technical Indicator
Posted On: February 2, 2024
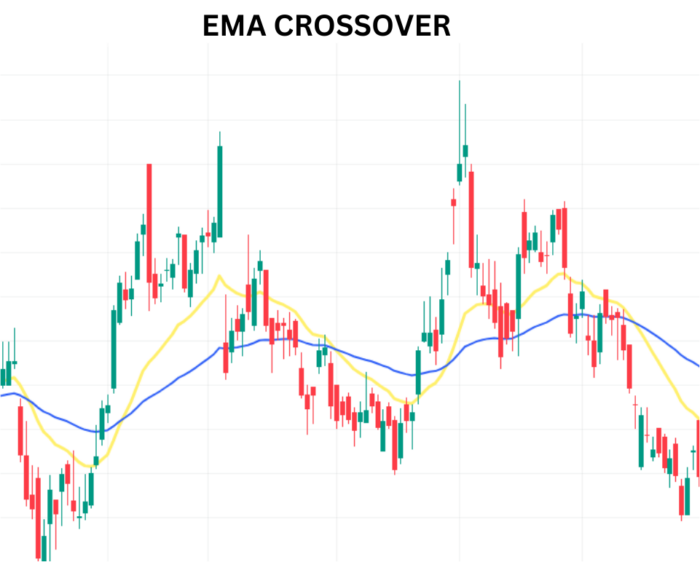
EMA Crossover Mastery: Navigating Market Trends with Precision
Success in the ever-changing world of trading requires an understanding of market patterns. The Exponential Moving Average (EMA) Crossover method is one effective technical indicator that traders frequently use. The 20-period EMA and the 60-period EMA are two EMAs that are used in this method to find possible trend reversals and entry possibilities. Let’s explore the nuances of EMA Crossover and learn how these moving averages’ interactions can influence your trading choices.
Understanding EMA Crossover
What is EMA?
EMA, or Exponential Moving Average, is a type of moving average that gives more weight to recent prices. It reacts more responsively to price changes compared to a Simple Moving Average (SMA). This characteristic makes EMAs particularly useful for trend-following strategies.
The 20EMA and 60EMA Crossover
The EMA Crossover strategy involves two key EMAs: the 20-period EMA and the 60-period EMA. The crossover of these two EMAs generates signals that traders use to identify potential changes in trend direction.
- Golden Cross (Bullish Signal):
- Occurs when the 20EMA crosses above the 60EMA.
- Signifies a potential upward trend reversal or the start of a bullish trend.
- Death Cross (Bearish Signal):
- Occurs when the 20EMA crosses below the 60EMA.
- Indicates a potential downward trend reversal or the initiation of a bearish trend.
Crafting Your EMA Crossover Strategy
1. Confirming Trend Reversals:
- Golden Cross and Death Cross events act as strong confirmations of potential trend reversals.
- Use additional technical indicators or price action analysis to validate signals.
2. Setting Stop-Loss and Take-Profit:
- Implement risk management by setting stop-loss orders to limit potential losses.
- Establish take-profit levels based on the expected price movement.
3. Considering Market Conditions:
- Analyze overall market conditions to ensure alignment with the identified trend.
- Adapt your strategy based on the prevailing market environment.
4. Combining with Other Indicators:
- Enhance the robustness of your strategy by incorporating other indicators.
- Popular additions include Relative Strength Index (RSI) and Moving Average Convergence Divergence (MACD).
Case Study: Navigating Market Trends with EMA Crossovers
Let’s consider a hypothetical scenario where a Golden Cross occurs on the daily chart of a stock. Traders observing this crossover might interpret it as a strong buy signal. By combining this information with other technical analysis tools, they can make well-informed trading decisions.
Conclusion: Riding the Waves with EMA Crossovers
EMA Crossover strategies, especially with the 20EMA and 60EMA, provide traders with a valuable framework for identifying potential trend reversals. By mastering the art of recognizing Golden Cross and Death Cross events, traders can ride the waves of market trends with confidence. As with any strategy, prudent risk management and adaptability to market conditions are key to long-term success.
Embark on your journey of mastering market trends with EMA Crossovers, and let these powerful signals guide you toward informed and strategic trading decisions.
xCalData is an exceptional app available for Android devices that offers unbiased insights into stocks, allowing investors to make informed decisions. With its user-friendly interface and comprehensive features, xCalData provides a valuable resource for anyone interested in the stock market. Download the app from google play.
For Actionable Intelligence, subscribe to xCalData app on Android devices: https://tinyurl.com/downloadxCalData
Popular Posts
-
Stock of Interest . August 23, 2024
#HSCL (NSE) Stock Report | 23 Aug 2024
-
Stock of Interest . August 23, 2024
Add Zerodha trading account to xCalData
-
Stock of Interest . August 23, 2024
What is xCalData , how to use it and how accurate is it?
-
Stock of Interest . August 23, 2024
Jurik Moving Average (JMA): A Profit Trading Insight