Technical Indicator
Posted On: February 5, 2024
Escape on Market Downs with Kairi Relative Index
Introduction to Kairi Relative Index (KRI)
The Kairi Relative Index (KRI) is a unique technical indicator designed to analyze market trends and provide insights into potential reversals. It gauges the current price of an asset relative to its historical performance, offering traders valuable information for decision-making.
Understanding KRI Calculation
Kairi Relative Index (KRI)=([Close−SMAn]/SMAn)×100
where:
SMA=Simple moving average
n=Number of periods averaged in SMA
Here, the “n-period” refers to the chosen time frame for calculating the Simple Moving Average.
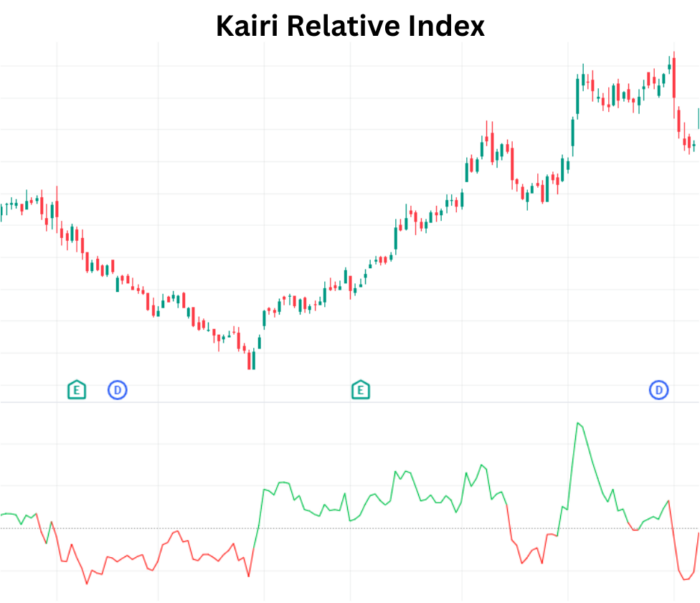
Interpreting KRI Values
The KRI values oscillate around zero, reflecting the asset’s current price position relative to its historical average. Traders can interpret KRI values as follows:
- Positive Values (Above Zero): Indicates that the current price is above the historical average, suggesting a potential bullish trend.
- Negative Values (Below Zero): Suggests that the current price is below the historical average, implying a potential
- xCalData is an exceptional app available for Android devices that offers unbiased insights into stocks, allowing investors to make informed decisions. With its user-friendly interface and comprehensive features, xCalData provides a valuable resource for anyone interested in the stock market. Download the app from google play.
- For Actionable Intelligence, subscribe to xCalData app on Android devices: https://tinyurl.com/downloadxCalData
- trend.
How to Use KRI in Trading Strategies
1. Identifying Trend Strength:
- Higher positive KRI values may indicate a strong bullish trend.
- Lower negative KRI values may suggest a robust bearish trend.
2. Spotting Reversal Signals:
- Reversals could be signaled when KRI changes direction, especially after reaching extreme levels.
3. Confirmation with Other Indicators:
- Use KRI in conjunction with other technical indicators for confirmation and robust analysis.
Conclusion
The Kairi Relative Index empowers traders with a simple yet effective tool to assess market trends and potential reversals. By incorporating KRI into your technical analysis toolkit and aligning it with other indicators, you can make more informed decisions in your trading journey. Keep exploring and experimenting with diverse indicators to enhance your market analysis skills. Happy trading!
xCalData is an exceptional app available for Android devices that offers unbiased insights into stocks, allowing investors to make informed decisions. With its user-friendly interface and comprehensive features, xCalData provides a valuable resource for anyone interested in the stock market. Download the app from google play.
For Actionable Intelligence, subscribe to xCalData app on Android devices: https://tinyurl.com/downloadxCalData
Popular Posts
-
Stock of Interest . August 23, 2024
#HSCL (NSE) Stock Report | 23 Aug 2024
-
Stock of Interest . August 23, 2024
Add Zerodha trading account to xCalData
-
Stock of Interest . August 23, 2024
What is xCalData , how to use it and how accurate is it?
-
Stock of Interest . August 23, 2024
Jurik Moving Average (JMA): A Profit Trading Insight