Technical Indicator
Posted On: January 29, 2024
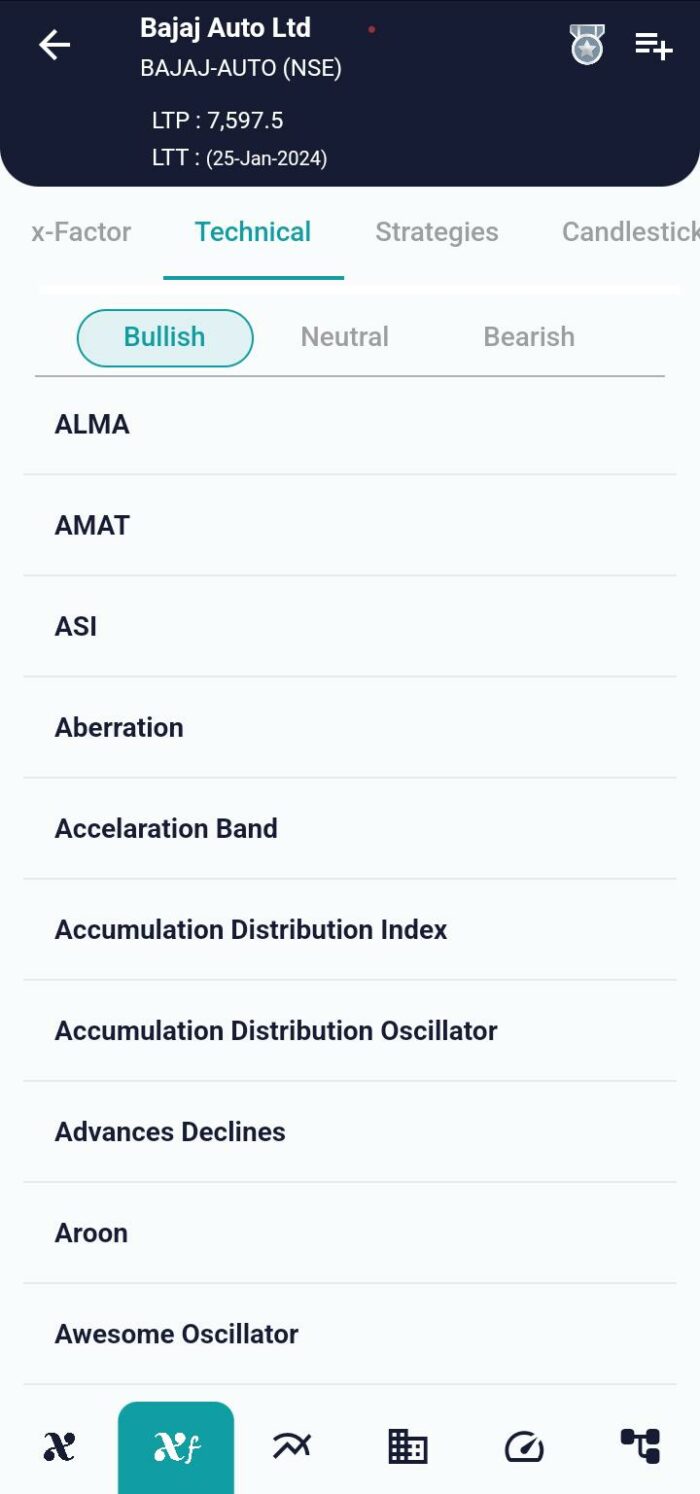
Exploring Aberration: Unraveling Volatility Indicator
In the vast realm of financial markets, traders are continually on the lookout for indicators that can provide insights into market volatility, helping them make informed decisions. One such intriguing indicator is the Aberration, a volatility technical indicator akin to the Keltner Channel. In this blog post, we will dive into the intricacies of Aberration, exploring its introduction, mathematical formula, and interpretation, shedding light on how traders can leverage it for a deeper understanding of market dynamics using xCaldata App.
Introduction:
The Aberration is a volatility indicator designed to capture and measure market fluctuations, similar to the Keltner Channel. Volatility technical indicator play a crucial role in helping traders identify potential market trends, making them valuable tools in decision-making.
Mathematical Formula:
Understanding the Aberration involves a series of calculations that derive meaningful bands reflecting the market’s volatility. Here’s the step-by-step mathematical formula:
- Calculate Average True Range (ATR): The ATR provides a measure of market volatility. It considers the high, low, and close prices to gauge the potential range of price movement.
- Calculate HLC (Average of High, Low, and Close): Determine the average of the high, low, and close prices, creating a composite value that represents the central tendency of the market.
- Calculate Simple Moving Average (SMA) for HLC: Employ a simple moving average to smooth out fluctuations in the HLC, providing a baseline for market trends.
- Calculate Aberration Upper Band: The upper band is derived by adding the SMA and ATR. This band reflects the potential upward volatility in the market.
- Calculate Aberration Lower Band: Conversely, the lower band is determined by subtracting the ATR from the SMA. This band signifies the potential downward volatility in the market.
Interpretation:
Understanding the interpretation of Aberration technical indicator is pivotal for traders looking to navigate market trends effectively.
- Uptrend: If the closing price surpasses the upper band, it signals an uptrend. This suggests that the market is experiencing higher volatility, and traders might consider potential buying opportunities.
- Downtrend: Conversely, if the closing price falls below the lower band, it indicates a downtrend. This suggests increased volatility in the downward direction, prompting traders to consider potential selling opportunities.
- Neutral: If the closing price remains within the bands, the market is deemed neutral. This scenario implies a relative stability in prices, and traders may exercise caution or look for potential reversal signals.
Real-World Application:
Consider a hypothetical scenario where a stock’s closing price consistently hovers above the upper band. Traders observing this pattern might interpret it as a signal of sustained upward volatility, signaling a potential uptrend. On the flip side, if the closing price consistently dips below the lower band, it could indicate sustained downward volatility, suggesting a potential downtrend.
Conclusion: Navigating Volatility with Aberration
In the dynamic world of financial markets, understanding and navigating volatility is key to making informed trading decisions. The Aberration, with its calculated bands derived from ATR and SMA, provides traders with a valuable tool to gauge and interpret market volatility. By identifying potential uptrends, downtrends, or periods of neutrality, traders can strategically position themselves in the market.
As with any technical indicator, it’s essential for traders to use Aberration judiciously, considering it alongside other indicators and market factors. A comprehensive analysis that integrates multiple perspectives enhances the accuracy of trading decisions.
xCalData is an exceptional app available for Android devices that offers unbiased insights into stocks, allowing investors to make informed decisions. With its user-friendly interface and comprehensive features, xCalData provides a valuable resource for anyone interested in the stock market. Download the app from google play.
For Actionable Intelligence, subscribe to xCalData app on Android devices: https://tinyurl.com/downloadxCalData
Popular Posts
-
Stock of Interest . August 23, 2024
#HSCL (NSE) Stock Report | 23 Aug 2024
-
Stock of Interest . August 23, 2024
Add Zerodha trading account to xCalData
-
Stock of Interest . August 23, 2024
What is xCalData , how to use it and how accurate is it?
-
Stock of Interest . August 23, 2024
Jurik Moving Average (JMA): A Profit Trading Insight