Candlestick Pattern
Posted On: August 23, 2023
Exploring the Bullish Breakaway Candlestick Pattern
A Comprehensive Manual for Traders:
Within the realm of technical analysis, candlestick patterns serve as crucial tools for deciphering market sentiment and spotting potential shifts in trends. Among these patterns, the Bullish Breakaway emerges as a robust signal for traders seeking signs of upward price movement. This blog post will delve into the distinct features of the Bullish Breakaway candlestick pattern, delve into methods for recognizing and interpreting it, and discuss its implications for refining trading strategies.
The Bullish Breakaway consists of a five-candlestick pattern that emerges during a downtrend, suggesting a possible shift towards bullish sentiment. The pattern commences with a prominent bearish candlestick, followed by a series of smaller bearish candlesticks. It concludes with a sizable bullish candlestick that surpasses the range of the preceding candles.
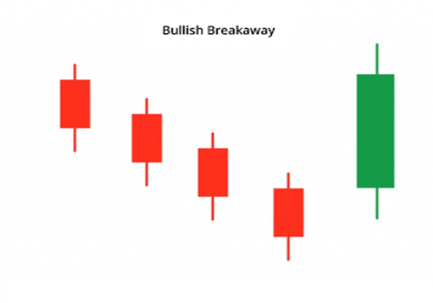
Characteristics of Bullish Breakaway:
Effectively recognizing the Bullish Breakaway pattern involves observing the following key traits:
- Initial Bearish Candlestick: The pattern initiates with a robust bearish candlestick, indicating an ongoing downtrend in the market.
- Series of Small Bearish Candlesticks: Subsequent to the initial bearish candle, a sequence of smaller bearish candles follows, signifying potential indecision and a weakening downtrend.
- Large Bullish Candlestick: The pattern culminates with a significant bullish candlestick that engulfs the range of the preceding candles. This indicates a potential shift in momentum towards bullish sentiment.
Interpreting the Bullish Breakaway Candlestick Pattern:
The Bullish Breakaway pattern suggests a possible shift from a downtrend to an uptrend. Traders perceive this pattern as a strong signal to consider buying or initiating long positions. It hints at a conceivable trend reversal and provides an opportunity to profit from anticipated upward price movement.
Confirmation and Trading Strategies:
While the Bullish Breakaway pattern offers a robust bullish signal, traders often seek additional confirmation prior to executing trades. Additional factors to consider include:
- Volume Confirmation: Higher trading volume accompanying the formation of the Bullish Breakaway bolsters the credibility of the bullish sentiment.
- Support and Resistance Levels: Recognizing crucial support and resistance levels reinforces the pattern’s importance and aids in determining appropriate price targets.
- Supplementary Technical Indicators: Integrating the Bullish Breakaway pattern with other technical indicators, such as moving averages, trendlines, or oscillators, can provide added confirmation and enhance trading decisions.
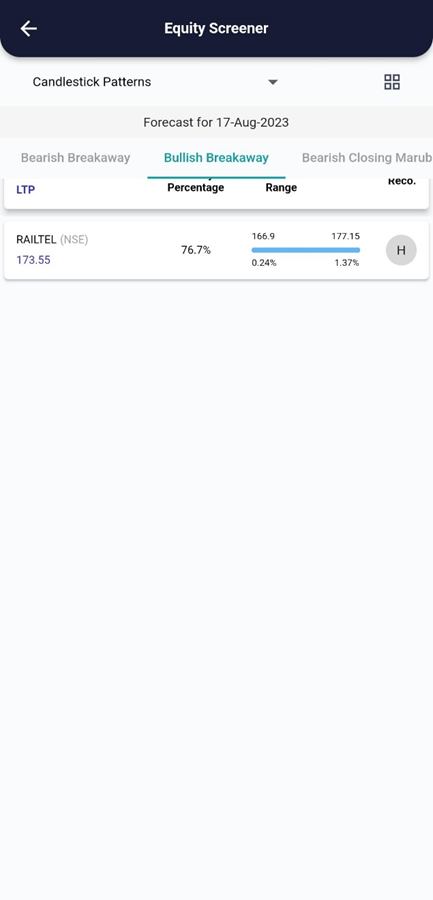
xCalData analyses the candles of individual stocks daily and identifies the stocks forming various patterns. Checkout xCalData app to know all the candle stick patterns formed by the stock of your interest.
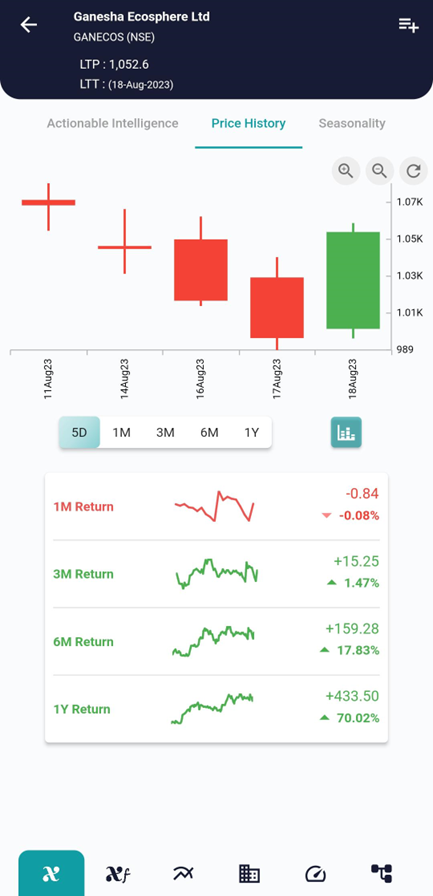
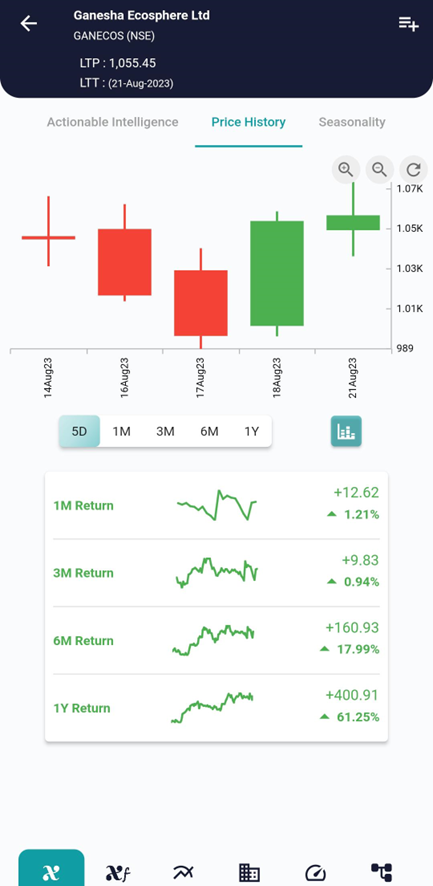
Example, on 18 Aug the stock showed the Bullish Breakaway pattern and on 21 Aug the stock started going up as can be seen in the interpretation above.
Conclusion:
The Bullish Breakaway candlestick pattern serves as a potent tool for traders, offering insights into potential trend reversals and shifts in market sentiment. By understanding its distinct traits and effectively identifying this pattern, traders can refine their trading strategies.
It’s crucial to understand that while patterns provide insights, they do not guarantee success; additional confirmation and comprehensive analysis are indispensable for informed trading decisions
Trading always involves risk, and it is crucial to develop a well-rounded trading strategy, including risk management techniques, to increase your productivity and achieve long-term success in the financial markets, Visit and download xCalData.
Where can I see further insights on this stock?
xCalData offers unbiased insights into stocks. Download the app from google play. For Actionable Intelligence, subscribe to xCalData app on Android devices: Download here

Disclaimer: The securities quoted are for illustration only and are not recommendatory.
Popular Posts
-
Stock of Interest . August 23, 2024
#HSCL (NSE) Stock Report | 23 Aug 2024
-
Stock of Interest . August 23, 2024
Add Zerodha trading account to xCalData
-
Stock of Interest . August 23, 2024
What is xCalData , how to use it and how accurate is it?
-
Stock of Interest . August 23, 2024
Jurik Moving Average (JMA): A Profit Trading Insight