Technical Indicator
Posted On: February 2, 2024
Fibonacci Retracement and Extension For Decoding Market Wisdom
In the vast realm of financial markets, mastering the art of technical analysis is a journey embarked upon by traders seeking insights into price movements. Among the myriad technical indicator available, Fibonacci retracement and extension stand out as powerful instruments that traders use to identify potential reversal levels, support, and resistance. Let’s embark on a journey into the world of Fibonacci, unraveling the secrets of retracement and extension strategies.
Understanding the Fibonacci Sequence:
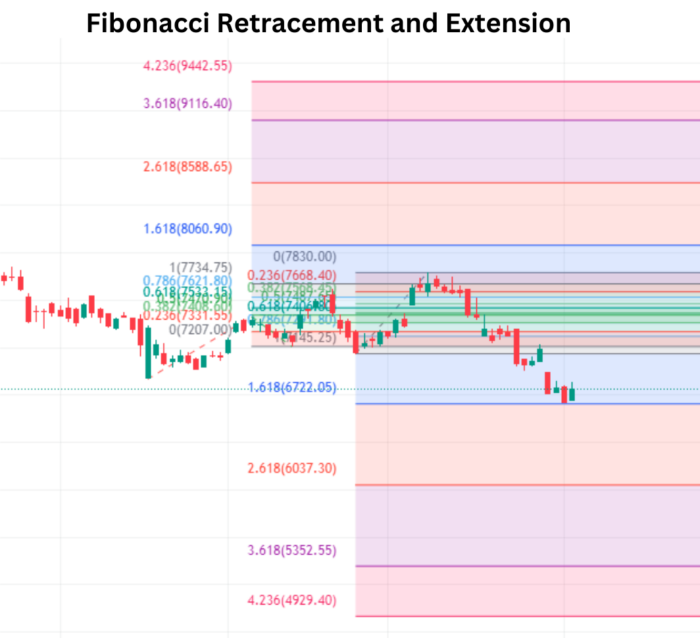
The Fibonacci Retracement and Extension sequence is a series of numbers where each number is the sum of the two preceding ones: 0, 1, 1, 2, 3, 5, 8, 13, 21, and so on. This sequence gives rise to the Fibonacci ratios, such as 0.618 (Golden Ratio) and 0.382, which have profound implications in financial markets.
Fibonacci Retracement: Unearthing Potential Reversal Levels:
Definition:
Fibonacci Retracement and Extension retracement is a technical analysis tool used to identify potential levels of support and resistance by plotting horizontal lines at key Fibonacci levels before the price continues in the original direction.
Application:
- Selecting Swing High and Low: Identify a significant price move by selecting a recent swing high and low.
- Plotting Fibonacci Levels: Plot Fibonacci retracement levels, typically at 23.6%, 38.2%, 50%, 61.8%, and 78.6%.
Interpretation:
- Support and Resistance: Fibonacci retracement levels act as potential support (in an uptrend) or resistance (in a downtrend).
- Key Levels: The 50% level is not a Fibonacci ratio but is often used, representing a halfway point.
Strategy:
- Buying Opportunities: Traders may look for buying opportunities near Fibonacci support levels during an uptrend.
- Selling Opportunities: In a downtrend, potential selling opportunities arise near Fibonacci resistance levels.
Fibonacci Extension: Projecting Future Price Levels:
Definition:
Fibonacci extension is a tool used to identify potential levels of future support or resistance by projecting key Fibonacci levels beyond the current price range.
Application:
- Selecting Anchor Points: Identify three significant points – a trend start, a significant peak or trough, and a pullback point.
- Plotting Extension Levels: Plot Fibonacci extension levels at 127.2%, 161.8%, 261.8%, and 423.6%.
Interpretation Fibonacci Retracement and Extension:
- Price Projection: Fibonacci Retracement and Extension levels indicate potential price targets for the next phase of the trend.
Strategy:
- Exit Points: Traders may use Fibonacci extension levels to set profit targets or identify potential reversal points.
- Trend Continuation: Extensions can be used to gauge the strength of an existing trend and anticipate its continuation.
The Psychology Behind Fibonacci:
The effectiveness of Fibonacci retracement and extension lies in the psychology of market participants. As traders widely use these levels, they become self-fulfilling prophecies, influencing decision-making and reinforcing the significance of these key levels.
Case Study: Navigating Market Moves with Fibonacci:
Consider a scenario where a currency pair exhibits a strong uptrend, and a trader applies Fibonacci retracement after a significant pullback. The price finds support near the 61.8% level, validating the Fibonacci strategy.
Conclusion: A Roadmap in Market Exploration:
Fibonacci retracement and extension serve as invaluable tools in a trader’s arsenal, offering a roadmap to potential reversal points, support, and resistance. By understanding the dynamics of these Fibonacci levels and integrating them into a comprehensive trading strategy, traders can enhance their ability to navigate the complex terrain of financial markets. Whether identifying entry points, setting profit targets, or gauging trend strength, Fibonacci retracement and extension strategies stand as pillars of precision in the pursuit of trading mastery. As you embark on your trading journey, let Fibonacci be your guide through the intricate tapestry of market dynamics.
xCalData is an exceptional app available for Android devices that offers unbiased insights into stocks, allowing investors to make informed decisions. With its user-friendly interface and comprehensive features, xCalData provides a valuable resource for anyone interested in the stock market. Download the app from google play.
For Actionable Intelligence, subscribe to xCalData app on Android devices: https://tinyurl.com/downloadxCalData
Popular Posts
-
Stock of Interest . August 23, 2024
#HSCL (NSE) Stock Report | 23 Aug 2024
-
Stock of Interest . August 23, 2024
Add Zerodha trading account to xCalData
-
Stock of Interest . August 23, 2024
What is xCalData , how to use it and how accurate is it?
-
Stock of Interest . August 23, 2024
Jurik Moving Average (JMA): A Profit Trading Insight