Technical Indicator
Posted On: February 8, 2024
Hoping Market Trends with Symmetric Weighted Moving Average (SWMA)
Introduction:
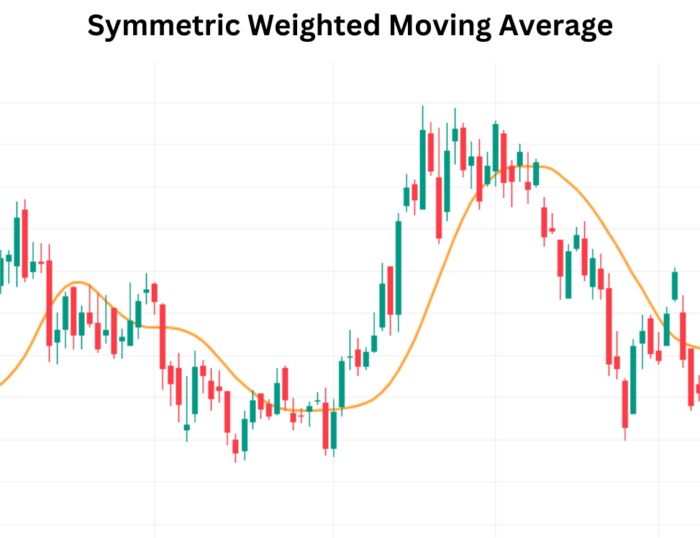
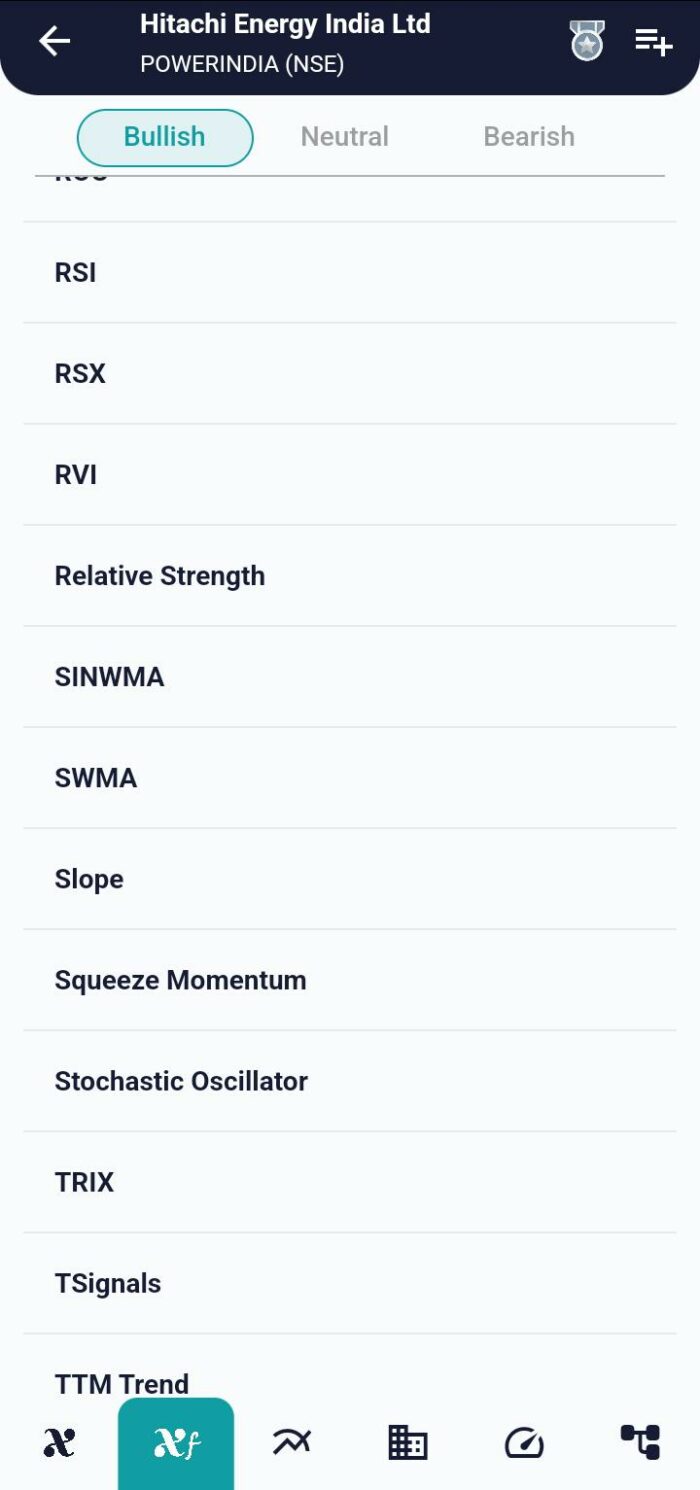
Symmetric Weighted Moving Average (SWMA) is a dynamic technical indicator with variable length, offering a unique perspective on market trends. This guide delves into the intricacies of SWMA, emphasizing its adaptable nature and its application in generating buy or sell signals based on directional changes by using xCaldata app.
Understanding Symmetric Weighted Moving Average (SWMA):
- Variable Length:
- Symmetric Weighted Moving Average incorporates weights based on a symmetric triangle, allowing for variable length.
- Example: For n=3, weights are [1, 2, 1]; for n=4, weights are [1, 2, 2, 1], and so on.
Interpretation for Trading Signals:
- Bullish Signal:
- When the Symmetric Weighted Moving Average value undergoes a change into a rising trend, it generates a buy signal.
- Bullish signals indicate a potential upward movement in the market.
- Bearish Signal:
- A falling SWMA value serves as a sell signal.
- Bearish signals suggest a potential downward movement in the market.
Trade Execution and Decision-Making:
- Buy Signal Execution:
- Traders may consider entering a long position when the SWMA value indicates a rising trend.
- Confirmation from other indicators and market analysis enhances the buy decision.
- Sell Signal Execution:
- Traders may contemplate entering a short position when the SWMA value indicates a falling trend.
- Confirmation from additional indicators and comprehensive analysis supports the sell decision.
Flexibility and Adaptability:
Variable Length Advantage:
SWMA’s variable length provides flexibility in adapting to changing market conditions.
Traders can adjust the length based on their preferred sensitivity and the dynamics of the asset being analyzed.
Conclusion:
Symmetric Weighted Moving Average (SWMA) introduces a dynamic and adaptable approach to market analysis, particularly with its variable length. By understanding the implications of rising and falling SWMA values, traders gain valuable insights into potential bullish or bearish trends. The indicator’s flexibility allows for customization, enabling market participants to align their strategies with the nuances of different financial instruments. As with any technical analysis tool, SWMA is most powerful when used in conjunction with a comprehensive trading strategy and thorough market assessment.
xCalData is an exceptional app available for Android devices that offers unbiased insights into stocks, allowing investors to make informed decisions. With its user-friendly interface and comprehensive features, xCalData provides a valuable resource for anyone interested in the stock market. Download the app from google play.
For Actionable Intelligence, subscribe to xCalData app on Android devices: https://tinyurl.com/downloadxCalData
Popular Posts
-
Stock of Interest . August 23, 2024
#HSCL (NSE) Stock Report | 23 Aug 2024
-
Stock of Interest . August 23, 2024
Add Zerodha trading account to xCalData
-
Stock of Interest . August 23, 2024
What is xCalData , how to use it and how accurate is it?
-
Stock of Interest . August 23, 2024
Jurik Moving Average (JMA): A Profit Trading Insight