Sector Analysis
Posted On: March 4, 2026
Indian Utility Sector Analysis | Mar 2026
Industry Overview
India’s utility sector—comprising electricity, water supply, and essential services—is a backbone of industrial and social infrastructure. The power sector alone contributes ~3% of GDP in FY25 (Economic Survey 2025–26). According to the CEA (Jan 2026), India’s installed electricity capacity reached ~520 GW, with renewables accounting for ~43% of total capacity. The sector is undergoing rapid transformation with green energy integration, digital grids, and efficiency reforms.
Market Size and Growth Metrics
- Installed Power Capacity (Jan 2026): ~ 520,510.95 MW (~520 GW)
- Renewable Generation (FY25–26): ~403 BU, nearly double compared to 2014 (MNRE).
- Electricity Generation (FY25): ~1,650 billion units (National Power Portal).
- Tap Water Coverage (Jan 2026): ~81.5% of rural households (JJM, Ministry of Jal Shakti).
- Sanitation Coverage: ~100% rural ODF status maintained under Swachh Bharat Mission (MoJS, 2026).
- Coal Consumption for Power (FY25): ~ 757.70 million tonnes (CEA).
- The utilities market size is expected to see strong growth in the next few years. It will grow to $9.39 trillion in 2030 at a compound annual growth rate (CAGR) of 6.1%
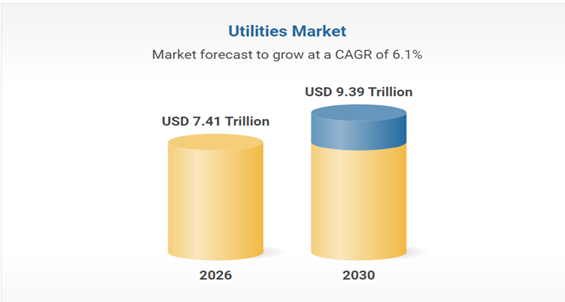
- Source: Research and Market
Market Dynamics and Drivers
- Growth Drivers: Rising electricity demand, renewable energy expansion, urbanization, and government reforms.
- Supply Chain: Power generation (thermal, hydro, nuclear, renewables), transmission, distribution, and water utilities.
- Technological Trends: Smart meters, AI-driven grid management, digital billing, and water recycling.
- Consumer Trends: Demand for reliable, affordable, and green utilities.
Competitive Landscape
- Major Players (Power): NTPC, Power Grid Corporation, NHPC, Adani Power, Tata Power.
- Public Sector: State Electricity Boards, Jal Boards (water utilities).
- Supplier Power: Moderate; coal and renewable suppliers influence costs.
- Buyer Power: High, with consumers demanding affordable tariffs and reliability.
- Threat of Substitutes: Rooftop solar, decentralized water systems.
Regulatory Measures
- Solid Waste Management Rules (2016, updated 2025): Mandates segregation and scientific disposal.
- Union Budget 2026: Allocated funds for renewable corridors and smart grids.
- CEA Guidelines (2026): Efficiency targets and renewable integration.
- Economic Survey 2025–26: Emphasis on utilities for sustainable growth.
Macro Environmental Analysis
- Rising electricity demand from industry and households.
- Budget 2026 emphasized renewable energy and smart grids.
- Coal dependency remains high, though renewables are expanding.
- ESG compliance and sustainability becoming mandatory.
- Digital platforms improving transparency in billing and supply.
SWOT Analysis
Strengths
- Large installed capacity base.
- Strong public sector presence.
- Expanding renewable energy share.
Weaknesses
- High dependence on coal.
- Transmission & distribution losses (~18% in FY25, CEA).
- Water utility inefficiencies in urban areas.
Opportunities
- Smart grids and digital utilities.
- Renewable energy corridors.
- Urban water recycling projects.
- Public-private partnerships.
Threats
- Global fuel price volatility.
- Climate change risks affecting water and power supply.
- Regulatory delays in reforms.
- Cybersecurity risks in digital utilities.
Future Outlook
- The utilities market size is expected to see strong growth in the next few years. It will grow to $9.39 trillion in 2030 at a compound annual growth rate (CAGR) of 6.1%.
- India’s 2030 NDC commitment to reach 500 GW of non‑fossil capacity—was actually achieved five years ahead of schedule
Conclusion
India’s utility sector is a strategic pillar of infrastructure and sustainable growth, contributing significantly to GDP. With strong government support, renewable integration, and digital transformation, the sector is poised for expansion. Addressing challenges such as coal dependency, transmission losses, and climate risks will be crucial for resilience and competitiveness.
Sources
Central Electricity Authority (Executive Summary Jan 2026),
National Power Portal (Daily & Monthly Generation Reports, Feb 2026),
Economic Survey 2025–26 (Ministry of Finance),
National Water Informatics Centre (2026)
What is xCalData?
xCalData is a Made in India AI powered investment research platform called RHOMB.
Using multilayered neural network, RHOMB analyses over 150+ technical ratios, 150+ candlestick chart patterns and over 40 fundamental ratios of each stock.
RHOMB forecasts the stock price movement for the next few days and determines buy, sell, hold or wait.
How accurate is xCalData?
xCalData publishes the accuracy of the past trades for each stock to enable an informed decision.
Is xCaldata an Algo trading platform?
No, xCalData is not an algotrading platform. User decides when to buy or sell including, we only provide inputs for the decision.
Download the app for further stock level insights: https://open.xcaldata.com/apps/
Checkout the trades and detailed insights in the app

Popular Posts
-
Stock of Interest . August 23, 2024
#HSCL (NSE) Stock Report | 23 Aug 2024
-
Stock of Interest . August 23, 2024
Add Zerodha trading account to xCalData
-
Stock of Interest . August 23, 2024
What is xCalData , how to use it and how accurate is it?
-
Stock of Interest . August 23, 2024
Jurik Moving Average (JMA): A Profit Trading Insight